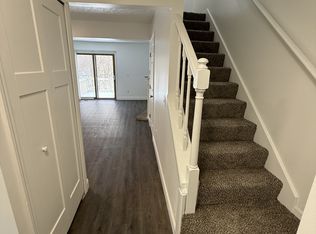
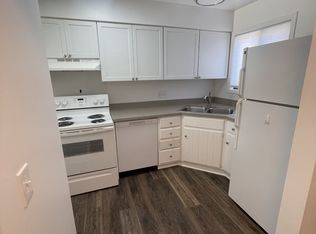
Welcome to our cozy townhome. Could be sold turn key. Newly remodeled 2025/26 with new carpet, vinyl flooring, new windows and window blinds, stainless steel kitchen appliances, updated bathrooms and fresh paint. Furnace, air, hot water heater, electrical panel and washer and dryer are all relatively new. Conveniently located near highways and many shopping centers. Walking distance to restaurants, grocery stores and public bus stop. Four miles from MSU campus. Enjoy the convenience of professional snow removal and lawn care. Community pool and clubhouse are located outside the back door where there is space for grilling or just hanging out. No restrictions on pets. 248-425-2779
For sale by owner
$169,900
2179 Trafalger St, East Lansing, MI 48823
2beds
1,060sqft
SingleFamily
Built in 1969
-- sqft lot
$152,300 Zestimate®
$160/sqft
$350/mo HOA
What's special
Fresh paintNew carpetVinyl flooringStainless steel kitchen appliancesUpdated bathrooms
What the owner loves about this home
Safe and friendly neighborhood. Close to everything. Warm bright and cozy
- 1 day
- 181
- 22
Listed by:
Property Owner (248) 425-2780
Facts & features
Interior
Bedrooms & bathrooms
- Bedrooms: 2
- Bathrooms: 2
- Full bathrooms: 1
- 1/2 bathrooms: 1
Heating
- Forced air
Appliances
- Included: Dishwasher, Dryer, Garbage disposal, Microwave, Range / Oven, Refrigerator, Washer
Features
- Flooring: Carpet, Laminate
- Basement: Partially finished
- Has fireplace: No
Interior area
- Total interior livable area: 1,060 sqft
Property
Parking
- Total spaces: 1
- Parking features: Carport
Features
- Exterior features: Vinyl, Brick
Details
- Parcel number: 33200101304115
Construction
Type & style
- Home type: SingleFamily
Condition
- New construction: No
- Year built: 1969
Community & HOA
HOA
- Has HOA: Yes
- HOA fee: $350 monthly
Location
- Region: East Lansing
Financial & listing details
- Price per square foot: $160/sqft
- Tax assessed value: $60,600
- Annual tax amount: $3,071
- Date on market: 11/17/2026
Estimated market value
$152,300
$140,000 - $166,000
$1,836/mo
Price history
| Date | Event | Price |
|---|---|---|
| 11/17/2026 | Listed for sale | $169,900+30.7%$160/sqft |
Source: Owner Report a problem | ||
| 8/9/2023 | Sold | $130,000+4.1%$123/sqft |
Source:  Greater Lansing AOR #274771 Report a problem | ||
| 8/7/2023 | Pending sale | $124,900$118/sqft |
Source: Greater Lansing AOR #274771 Report a problem | ||
| 7/28/2023 | Contingent | $124,900$118/sqft |
Source: Greater Lansing AOR #274771 Report a problem | ||
| 7/26/2023 | Listed for sale | $124,900$118/sqft |
Source: Greater Lansing AOR #274771 Report a problem | ||
Public tax history
| Year | Property taxes | Tax assessment |
|---|---|---|
| 2025 | $3,071 +41.5% | $60,600 +10% |
| 2024 | $2,170 | $55,100 +20.6% |
| 2023 | -- | $45,700 +11.2% |
| 2022 | -- | $41,100 +4.1% |
| 2021 | -- | $39,500 +5.6% |
| 2020 | -- | $37,400 +13.7% |
| 2019 | $2,009 | $32,900 +4.1% |
| 2018 | $2,009 | $31,600 +5% |
| 2017 | -- | $30,100 +1.3% |
| 2016 | -- | $29,700 +10.8% |
| 2015 | -- | $26,800 +8.1% |
| 2014 | -- | $24,800 -14.2% |
| 2013 | -- | $28,900 +10.7% |
| 2012 | -- | $26,100 -6.5% |
| 2011 | -- | $27,900 -28.1% |
| 2010 | -- | $38,800 -6.7% |
| 2009 | -- | $41,600 -4.4% |
| 2008 | -- | $43,500 +3.1% |
| 2007 | -- | $42,200 +3.7% |
| 2006 | -- | $40,700 +6.5% |
| 2005 | -- | $38,200 +7% |
| 2004 | -- | $35,700 +7.2% |
| 2003 | -- | $33,300 +7.8% |
| 2002 | -- | $30,900 +3.3% |
| 2001 | -- | $29,900 +6.4% |
| 2000 | -- | $28,100 |
Find assessor info on the county website
Monthly payment
Est. payment
Payment breakdown
Explore the cost of this home by adjusting the details. Changes won't be saved.Climate risks
Neighborhood: Pinecrest


Similar homes
- $179,9004 bd1 ba1.1k sqft1311 W Saginaw St, East Lansing, MI 48823For Sale
 MLS ID #300551, Chuck Snyder, Home Towne Real Estate. Greater Lansing AOR
- $149,9002 bd1 ba900 sqft3485 E Lake Lansing Rd, East Lansing, MI 48823For Sale
 MLS ID #298978, MacIntyre & Cowen Team, RE/MAX Real Estate Professionals. Greater Lansing AOR
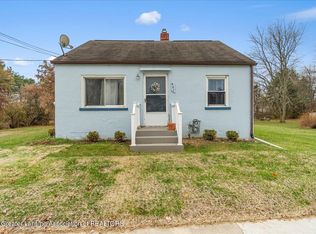
- $145,0003 bd1 ba880 sqft421 W Lake Lansing Rd, East Lansing, MI 48823For Sale
 MLS ID #295156, Morgan Meredith, Keller Williams Realty Lansing. Greater Lansing AOR
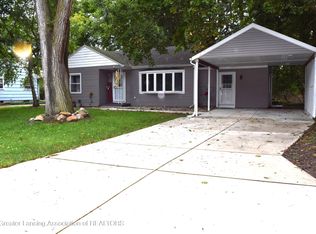
- $189,0002 bd1 ba1.2k sqft1035 Robb St, East Lansing, MI 48823For Sale
 MLS ID #299306, Janet Munn, Berkshire Hathaway HomeServices. Greater Lansing AOR
- $179,9002 bd1 ba768 sqft545 Cornell Ave, East Lansing, MI 48823For Sale
 MLS ID #50219948, Lucy W Ham, Ham Group Realty. MiRealSource
- $250,0003 bd3 ba1k sqft1631 Mount Vernon Ave, East Lansing, MI 48823For Sale
 MLS ID #26054722, Esteban Rubio-Leos, eXp Realty, LLC. MichRIC
