We are pleased to offer this Contemporary Cape Cod home. This home is 1,532 square feet of great living space and features: 3 bedrooms, 2.5 bathrooms, Living room, Dining room, AC, Large Fenced Yard & Patio, Double Car Garage with Garage Cabinets, Primary Bedroom with Walk-In Closet, Air Conditioning, Garage Parking, Dishwasher, Fenced back yard, Refrigerator Supplied, Washer & Dryer hookups, This home is located within the Battle Ground School District and is within the following school boundaries: Elementary: Maple Grove, Middle School: Daybreak, High School: Prairie High, Close to bus line, shopping, health and wellness, dining, and parks.
For sale by owner
$450,000
2212 SW 10th St, Battle Ground, WA 98604
3beds
1,532sqft
SingleFamily
Built in 1997
6,146 Square Feet Lot
$-- Zestimate®
$294/sqft
$-- HOA
What's special
Washer and dryer hookupsDining roomRefrigerator supplied
What the owner loves about this home
Close in property near the center of dining, shopping & parks.
- 6 days
- 486
- 32
Listed by:
Property Owner (360) 334-3458
Facts & features
Interior
Bedrooms & bathrooms
- Bedrooms: 3
- Bathrooms: 3
- Full bathrooms: 2
- 1/2 bathrooms: 1
Heating
- Heat pump
Cooling
- Central
Appliances
- Included: Dishwasher, Range / Oven, Refrigerator
- Laundry: In Unit
Features
- Flooring: Carpet, Linoleum / Vinyl
- Basement: None
Interior area
- Total interior livable area: 1,532 sqft
Property
Parking
- Total spaces: 3
- Parking features: Garage - Attached, Off-street
Features
- Exterior features: Vinyl, Wood products
- View description: None
Lot
- Size: 6,146 Square Feet
Details
- Parcel number: 192683354
Construction
Type & style
- Home type: SingleFamily
- Architectural style: Conventional
Materials
- steel
- Roof: Composition
Condition
- New construction: No
- Year built: 1997
Community & HOA
Location
- Region: Battle Ground
Financial & listing details
- Price per square foot: $294/sqft
- Tax assessed value: $435,021
- Annual tax amount: $2,778
- Date on market: 11/11/2026
Estimated market value
Not available
Estimated sales range
Not available
$2,464/mo
Price history
| Date | Event | Price |
|---|---|---|
| 11/11/2026 | Listed for sale | $450,000+104.5%$294/sqft |
Source: Owner Report a problem | ||
| 11/23/2023 | Listing removed | -- |
Source: Zillow Rentals Report a problem | ||
| 11/16/2023 | Listed for rent | $2,295+20.8%$1/sqft |
Source: Zillow Rentals Report a problem | ||
| 4/20/2021 | Listing removed | -- |
Source: Zillow Rental Manager Report a problem | ||
| 4/16/2021 | Listed for rent | $1,900$1/sqft |
Source: Zillow Rental Manager Report a problem | ||
| 9/21/2015 | Sold | $220,000+43.9%$144/sqft |
Source: Public Record Report a problem | ||
| 9/26/2003 | Sold | $152,900+19.5%$100/sqft |
Source: Public Record Report a problem | ||
| 10/24/1997 | Sold | $127,899$83/sqft |
Source: Public Record Report a problem | ||
Public tax history
| Year | Property taxes | Tax assessment |
|---|---|---|
| 2025 | $2,778 -12.3% | $435,021 +11.7% |
| 2024 | $3,168 +15% | $389,349 +1.1% |
| 2023 | $2,755 -11.3% | $385,175 +3.1% |
| 2022 | $3,107 +6% | $373,731 +8.5% |
| 2021 | $2,931 +17.9% | $344,297 +15.6% |
| 2020 | $2,487 | $297,855 +4% |
| 2019 | $2,487 +20.6% | $286,485 +3% |
| 2018 | $2,063 -14% | $278,196 +17.1% |
| 2017 | $2,399 +15% | $237,636 +5.5% |
| 2016 | $2,087 +0.7% | $225,166 +9.7% |
| 2015 | $2,073 -0.4% | $205,267 +4.9% |
| 2014 | $2,082 | $195,629 +9.7% |
| 2013 | $2,082 +11.9% | $178,256 +12.2% |
| 2012 | $1,861 +4.4% | $158,862 -4% |
| 2011 | $1,783 +22.1% | $165,555 -0.7% |
| 2010 | $1,460 -5.4% | $166,753 -2.1% |
| 2009 | $1,542 | $170,268 -23.2% |
| 2008 | -- | $221,800 |
| 2007 | -- | $221,800 +51.8% |
| 2005 | -- | $146,100 |
| 2004 | -- | $146,100 +15.1% |
| 2001 | $1,297 -6.6% | $126,900 -4.6% |
| 2000 | $1,388 | $133,000 |
Find assessor info on the county website
Monthly payment
Est. payment
Payment breakdown
Explore the cost of this home by adjusting the details. Changes won't be saved.Climate risks
Neighborhood: 98604


Similar homes
- $457,7003 bd2 ba1.4k sqft2300 SW 11th St, Battle Ground, WA 98604Active
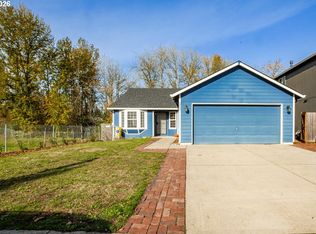
 MLS ID #493881244, Tracie DeMars, eXp Realty LLC. RMLS (OR)
- $455,0003 bd2 ba1.4k sqftQuail Hollow, Battle Ground, WA 98604Active
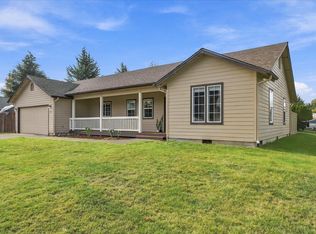 MLS ID #2601180, Mary Boal. NWMLS as distributed by MLS GRID
- $--4 bd2 ba2k sqft1813 NW 3rd St, Battle Ground, WA 98604AuctionServiceLink Auction
- $450,0003 bd2 ba1.4k sqft601 NW 29th Pl, Battle Ground, WA 98604Active
 MLS ID #574750366, Anthony Brungardt, eXp Realty LLC. RMLS (OR)
- $460,0004 bd2 ba1.5k sqft1308 SW 2nd Ave, Battle Ground, WA 98604ActiveMLS ID #344500309, Steph Tornow, Real Broker LLC. RMLS (OR)
- $485,0003 bd3 ba1.5k sqft1816 SW 6th St, Battle Ground, WA 98604ActiveMLS ID #778460757, Victoria Gooley, Opt. RMLS (OR)
- $439,9003 bd2 ba1k sqft1100 SE 4th Ave, Battle Ground, WA 98604ActiveMLS ID #773432745, Shannon Gruelle, Premiere Property Group LLC. RMLS (OR)
- $464,9003 bd2 ba1.4k sqft2520 NW 6th St, Battle Ground, WA 98604ActiveMLS ID #623351364, Daniel Brooks, Coldwell Banker Cascade Real Estate. RMLS (OR)
- $439,9004 bd3 ba1.9k sqft114 NE 14th St, Battle Ground, WA 98604ActiveMLS ID #603063926, Cary Minden, CJM Realty, LLC. RMLS (OR)
- $439,0005 bd4 ba2k sqft504 SE 5th St, Battle Ground, WA 98604ActiveMLS ID #409399705, Wendy Wampach, Imagine Homes Realty, LLC. RMLS (OR)
- $509,9003 bd2 ba1.7k sqft116 SW 10th St, Battle Ground, WA 98604ActiveMLS ID #143907378, Rickey Dallum, Kelly Right Real Estate of Seattle LLC. RMLS (OR)
- $429,9003 bd2 ba1k sqft1310 NW 4th St, Battle Ground, WA 98604ActiveMLS ID #531462281, Oksana Berezhnoy, Keller Williams Realty. RMLS (OR)
- $420,0003 bd3 ba1.6k sqft1106 SE 6th St, Battle Ground, WA 98604ActiveMLS ID #776002913, Brandon Fox, Keller Williams Realty. RMLS (OR)
