Attention investors! Or anyone that wants to be a landlord. Maybe live in unit and rent the others. This 3 unit in the house and 1 back house. So back house is a 1 bed 1 bath. In the house the upstairs is a studio apartment. Main floor is 2 bed 1 bath that includes a 2 car garage. Basement has 1 bed 1 bath in the newly remodeled unit.
Active
$450,000
2217 8th Ave N, Great Falls, MT 59401
--beds
--baths
2,865sqft
Quadruplex, Multi Family
Built in 1910
-- sqft lot
$432,200 Zestimate®
$157/sqft
$-- HOA
What's special
- 4 days
- 81
- 0
Likely to sell faster than
Zillow last checked:
Listing updated:
Listed by:
Kim O'Haire 406-899-4772,
Dahlquist Realtors
Source: MRMLS,MLS#: 30080066
Facts & features
Interior
Appliances
- Laundry: Washer Hookup
Features
- Has basement: No
- Has fireplace: No
Interior area
- Total structure area: 2,865
- Total interior livable area: 2,865 sqft
Property
Parking
- Total spaces: 2
- Parking features: Garage
- Garage spaces: 2
Lot
- Size: 7,840 Square Feet
Details
- Parcel number: 02301606432050000
- Zoning description: 1
- Special conditions: Standard
Construction
Type & style
- Home type: MultiFamily
- Property subtype: Quadruplex, Multi Family
Materials
- Foundation: Poured
Condition
- New construction: No
- Year built: 1910
Community & HOA
Location
- Region: Great Falls
Financial & listing details
- Price per square foot: $157/sqft
- Tax assessed value: $269,505
- Annual tax amount: $4,142
- Date on market: 10/20/2026
- Listing agreement: Exclusive Right To Sell
Estimated market value
$432,200
$411,000 - $454,000
$1,644/mo
Price history
| Date | Event | Price |
|---|---|---|
| 10/20/2026 | Listed for sale | $450,000$157/sqft |
Source:  MRMLS #30080066 Report a problem | ||
Public tax history
| Year | Property taxes | Tax assessment |
|---|---|---|
| 2025 | $1,613 -24.5% | $269,505 +17.5% |
| 2024 | $2,137 -1.8% | $229,400 |
| 2023 | $2,175 +22.7% | $229,400 +32.1% |
| 2022 | $1,773 -3.4% | $173,598 |
| 2021 | $1,836 +6% | $173,598 +5.9% |
| 2020 | $1,733 +4.3% | $163,860 |
| 2019 | $1,661 -5.6% | $163,860 +14.2% |
| 2018 | $1,759 +5.6% | $143,455 |
| 2017 | $1,666 -45.4% | $143,455 +3.5% |
| 2016 | $3,054 +129.1% | $138,655 |
| 2015 | $1,333 -4.8% | $138,655 +113.1% |
| 2014 | $1,400 +26% | $65,074 +1.2% |
| 2013 | $1,110 +2.4% | $64,314 +1.4% |
| 2012 | $1,085 | $63,417 |
| 2011 | -- | -- |
| 2010 | -- | -- |
| 2009 | -- | -- |
| 2008 | -- | $94,193 |
| 2007 | -- | $94,193 +4.5% |
| 2006 | -- | $90,173 |
| 2005 | -- | $90,173 |
| 2004 | -- | $90,173 |
| 2003 | -- | $90,173 +34.4% |
| 2002 | -- | $67,081 |
| 2000 | -- | $67,081 |
Find assessor info on the county website
Monthly payment
Est. payment
Payment breakdown
Explore the cost of this home by adjusting the details. Changes won't be saved.Climate risks
Neighborhood: 59401

Similar homes
- $505,0005 bd3 ba3.3k sqft3027 3rd Ave N, Great Falls, MT 59401Active Under Contract

 MLS ID #30078192, Marie Willson, HomeSmart Realty Partners. MRMLS
- $475,0006 bd4 ba2k sqft2904 2nd Ave N, Great Falls, MT 59401Active
 MLS ID #30074178, Marsha Clark, Canyon Properties LLC. MRMLS
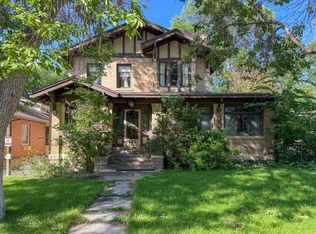
- $499,0007 bd4 ba3.5k sqft625 3rd Ave N, Great Falls, MT 59401For Sale
 MLS ID #414716, Lynn Kenyon, Live in Montana Real Estate. Big Sky Country MLS
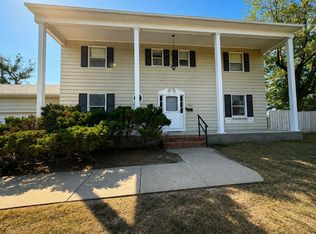
- $449,9004 bd4 ba3.5k sqft1700 32nd St S, Great Falls, MT 59405Active
 MLS ID #30076816, Lorelei Walden, RE/MAX of Great Falls. MRMLS
- $449,5005 bd3 ba3k sqft609 Alice Dr, Great Falls, MT 59405ActiveMLS ID #30075986, Tony Peres, Dascoulias Realty Group. MRMLS
- $519,500-- bd-- ba2.8k sqft526 5th Ave N, Great Falls, MT 59401ActiveMLS ID #30079298, Shannon McDonald, Montana Realty. MRMLS
- $450,0004 bd3 ba2.1k sqft1104 Durango Dr, Great Falls, MT 59404ActiveMLS ID #30079496, Brenna Adkins, Dahlquist Realtors. MRMLS
- $499,0003 bd2 ba1.8k sqft1516 39th St S, Great Falls, MT 59405ActiveMLS ID #30077887, Adam Monroe, Monroe Realty Group. MRMLS
- $484,9004 bd3 ba2.2k sqft309 29th Ave NE, Great Falls, MT 59404Active Under ContractMLS ID #30079293, Paul Dockter, Roe River Realty. MRMLS
- $454,0005 bd3 ba3.7k sqft320 9th Ave SW, Great Falls, MT 59404ActiveMLS ID #30078273, Casey O'Neill, eXP Realty LLC - Great Falls. MRMLS
- $570,0006 bd4 ba2.3k sqft1400 2nd Ave N, Great Falls, MT 59401Active Under ContractMLS ID #30074217, Adam Goodover, Professional Brokers of Great Falls. MRMLS
- $279,0005 bd2 ba2.2k sqft1821 6th Ave N, Great Falls, MT 59401ActiveMLS ID #30077165, Jesse Hursh, Dahlquist Realtors. MRMLS
- $330,0004 bd2 ba1.9k sqft2526 4th Ave N, Great Falls, MT 59401ActiveMLS ID #30076763, Brenna Adkins, Dahlquist Realtors. MRMLS
- $479,0003 bd3 ba2.6k sqft413 33rd Ave NE, Great Falls, MT 59404Active Under ContractMLS ID #30079096, Ambyr Rain Showers, Dustin Young and Company. MRMLS
- $426,9994 bd2 ba1.9k sqft2425 9th Ave S, Great Falls, MT 59405ActiveMLS ID #30070443, Joe McKenney, Keller Williams Northern MT. MRMLS
- $460,0004 bd2 ba2.3k sqft721 56th St S, Great Falls, MT 59405ActiveMLS ID #30077040, Sharon Virgin, Dustin Young and Company. MRMLS
- $227,5003 bd2 ba1.4k sqft1512 6th Ave N, Great Falls, MT 59401ActiveMLS ID #30078399, Paula Brandon Fry, Dahlquist Realtors. MRMLS
- $335,0003 bd3 ba1.6k sqft1020 5th Ave N, Great Falls, MT 59401ActiveMLS ID #30075750, Ron Dodd, Fathom Realty MT, LLC. MRMLS
- $389,0004 bd3 ba3.2k sqft3200 3rd Ave S, Great Falls, MT 59405Active Under ContractMLS ID #30072233, John Ditore, Live in Montana Real Estate. MRMLS
- $315,0003 bd2 ba1.5k sqft2517 7th Ave N, Great Falls, MT 59401Active Under ContractMLS ID #30072770, Jen Barnett, The Front Agency. MRMLS
