TURNKEY 10-UNIT MULTIFAMILY INVESTMENT IN NORTHSIDE-NORTHLINE
Incredible cash-flow opportunity for seasoned investors or portfolio expansion. Located at 26 Farrell St, this low-rise multifamily property features 10 individual units optimized for strong rental demand. Positioned on a spacious lot, the building boasts a highly functional layout consisting of 1-bedroom, 1-bathroom units—the ideal sweet spot for low vacancy and consistent tenant retention. Tenants will love the extreme convenience: the property sits just 10 minutes from the University of Houston-Downtown, under a mile from the Northline Transit Center, and features dedicated off-street parking.
For sale
$900,000
26 Farrell St APT 10, Houston, TX 77022
1beds
6,826sqft
Multi Family
Built in 1964
-- sqft lot
$-- Zestimate®
$132/sqft
$-- HOA
What's special
Spacious lotHighly functional layoutDedicated off-street parking
- 36 days
- 36
- 5
Zillow last checked:
Listing updated:
Listed by:
Ketul Patel TREC #0604614 832-659-9611,
Champions NextGen Real Estate
Source: HAR,MLS#: 91560600
Facts & features
Interior
Bedrooms & bathrooms
- Bedrooms: 1
- Bathrooms: 1
- Full bathrooms: 1
Heating
- Wall Furnace
Cooling
- Window Unit(s)
Appliances
- Included: Disposal, Refrigerator
Features
- Flooring: Laminate, Tile, Vinyl
Interior area
- Total structure area: 6,826
- Total interior livable area: 6,826 sqft
Property
Features
- Stories: 1
Lot
- Size: 0.3 Acres
- Features: Lot Size Restricted
Details
- Parcel number: 0670130020029
Construction
Type & style
- Home type: MultiFamily
- Property subtype: Multi Family
Materials
- Brick, Wood Siding
- Roof: Composition
Condition
- New construction: No
- Year built: 1964
Utilities & green energy
- Utilities for property: Cable Connected, Electricity Available, Water Connected
Community & HOA
Community
- Subdivision: Farrell Gardens
Location
- Region: Houston
Financial & listing details
- Price per square foot: $132/sqft
- Tax assessed value: $915,569
- Annual tax amount: $19,934
- Date on market: 9/24/2026
- Lease term: 1 Year,6 Month
Estimated market value
Not available
Estimated sales range
Not available
$1,061/mo
Price history
| Date | Event | Price |
|---|---|---|
| 9/24/2026 | Listed for sale | $900,000+12.5%$132/sqft |
Source:  HAR #91560600 Report a problem | ||
| 10/29/2025 | Listing removed | $845 |
Source:  HAR #32519641 Report a problem | ||
| 9/24/2025 | Listed for rent | $845-0.6% |
Source: HAR #32519641 Report a problem | ||
| 9/16/2025 | Listing removed | $850 |
Source: HAR #49550022 Report a problem | ||
| 7/15/2025 | Listed for rent | $850 |
Source: HAR #49550022 Report a problem | ||
| 1/9/2023 | Sold | -- |
Source: Agent Provided Report a problem | ||
| 12/11/2022 | Pending sale | $799,777$117/sqft |
Source: HAR #15468074 Report a problem | ||
| 11/22/2022 | Listing removed | -- |
Source: Zillow Rental Network_1 Report a problem | ||
| 11/8/2022 | Listed for rent | $850 |
Source: Zillow Rental Network_1 #10942381 Report a problem | ||
| 10/14/2022 | Price change | $799,777-8.6%$117/sqft |
Source: HAR #15468074 Report a problem | ||
| 9/27/2022 | Price change | $875,000-7.9%$128/sqft |
Source: HAR #67045293 Report a problem | ||
| 9/16/2022 | Price change | $949,888-2.6%$139/sqft |
Source: HAR #67045293 Report a problem | ||
| 8/29/2022 | Price change | $974,888-2.5%$143/sqft |
Source: HAR #67045293 Report a problem | ||
| 8/10/2022 | Listed for sale | $999,888+33.3%$146/sqft |
Source: HAR #67045293 Report a problem | ||
| 5/29/2021 | Listing removed | -- |
Source: Owner Report a problem | ||
| 3/29/2021 | Pending sale | $750,000$110/sqft |
Source: Owner Report a problem | ||
| 3/12/2021 | Listed for sale | $750,000$110/sqft |
Source: Owner Report a problem | ||
| 2/9/2021 | Listing removed | -- |
Source: Owner Report a problem | ||
| 12/3/2020 | Listed for sale | $750,000$110/sqft |
Source: Owner Report a problem | ||
| 11/28/2020 | Pending sale | $750,000$110/sqft |
Source: Owner Report a problem | ||
| 10/21/2020 | Listed for sale | $750,000$110/sqft |
Source: Owner Report a problem | ||
Public tax history
| Year | Property taxes | Tax assessment |
|---|---|---|
| 2025 | $19,458 -8.8% | $915,569 -10.3% |
| 2024 | $21,346 +7.1% | $1,020,197 +3.1% |
| 2023 | $19,937 +14.2% | $989,531 +24.8% |
| 2022 | $17,452 | $792,587 +10.1% |
| 2021 | -- | $719,917 +8.4% |
| 2020 | $15,930 +18.8% | $663,923 +19.9% |
| 2019 | $13,409 +66.9% | $553,721 +71.6% |
| 2018 | $8,034 | $322,681 +1.5% |
| 2017 | $8,034 +44.6% | $318,024 +44.7% |
| 2016 | $5,556 -1.6% | $219,728 -1.6% |
| 2015 | $5,646 | $223,234 +1.6% |
| 2014 | $5,646 | $219,615 +1.8% |
| 2013 | -- | $215,755 +6.1% |
| 2011 | -- | $203,415 +13.6% |
| 2010 | -- | $178,998 +1.7% |
| 2009 | -- | $176,084 -3.2% |
| 2008 | -- | $181,923 +43.7% |
| 2007 | -- | $126,588 +8.2% |
| 2006 | -- | $116,975 -18.4% |
| 2005 | -- | $143,381 +41.3% |
| 2004 | -- | $101,500 |
| 2003 | -- | $101,500 +5.2% |
| 2002 | -- | $96,460 +6.5% |
| 2001 | -- | $90,550 -13.8% |
| 2000 | -- | $105,000 |
Find assessor info on the county website
Monthly payment
Est. payment
Payment breakdown
Explore the cost of this home by adjusting the details. Changes won't be saved.Climate risks
Neighborhood: Northside-Northline
Nearby schools
Schools provided by the listing agent
- Elementary: Burbank Elementary School
- Middle: Burbank Middle School
- High: Sam Houston Math Science And Technology Center
Source: HAR. This data may not be complete. We recommend contacting the local school district to confirm school assignments for this home.


Similar homes
- $970,0002 bd2 ba3.6k sqft7715 W Hardy Rd, Houston, TX 77022For Sale
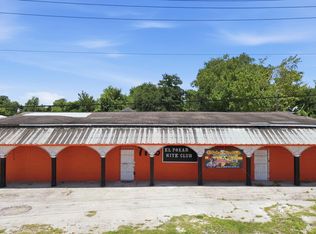 MLS ID #59252703, Teresa Sanchez, Keller Williams Realty Professionals. HAR
- $899,9903 bd2 ba4.8k sqft1423-1421 E 36th St, Houston, TX 77022New Construction
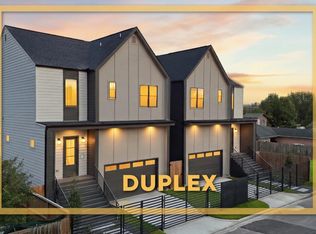 MLS ID #9956096, Ashwin Kewalramani, New Age. HAR
- $859,0004 bd5 ba3.5k sqft701 W 39th St, Houston, TX 77018For Sale
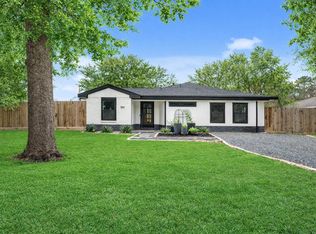 MLS ID #29809700, Ariston Cabangbang, Cabangbang Realty. HAR
- $950,0003 bd2 ba3.6k sqft505 Harvard St, Houston, TX 77007For Sale
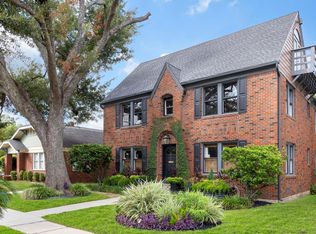 MLS ID #10746312, Cheryl Ford, Compass RE Texas, LLC - The Woodlands. HAR
