This 1638 square foot single family home has 3 bedrooms and 2.0 bathrooms. This home is located at 2630 Webber St, Sarasota, FL 34239.
Pre-foreclosure
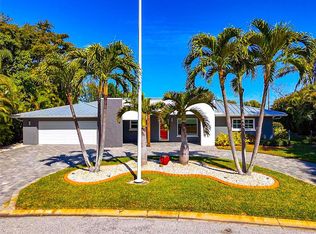
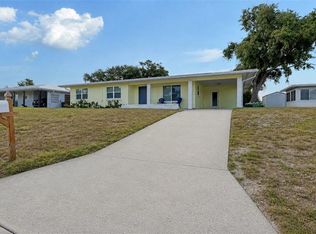
Street View
Est. $423,400
2630 Webber St, Sarasota, FL 34239
3beds
2baths
1,638sqft
SingleFamily
Built in 1957
0.25 Acres Lot
$423,400 Zestimate®
$258/sqft
$6/mo HOA
Overview
- 296 days |
- 13 |
- 1 |
Facts & features
Interior
Bedrooms & bathrooms
- Bedrooms: 3
- Bathrooms: 2
Heating
- Other
Features
- Flooring: Other
Interior area
- Total interior livable area: 1,638 sqft
Property
Parking
- Parking features: Garage - Attached
Features
- Exterior features: Cement / Concrete
Lot
- Size: 0.25 Acres
Details
- Parcel number: 0057010065
Construction
Type & style
- Home type: SingleFamily
Materials
- masonry
- Foundation: Concrete
- Roof: Shake / Shingle
Condition
- Year built: 1957
Community & HOA
HOA
- Has HOA: Yes
- HOA fee: $6 monthly
Location
- Region: Sarasota
Financial & listing details
- Price per square foot: $258/sqft
- Tax assessed value: $359,100
- Annual tax amount: $1,953
Visit our professional directory to find a foreclosure specialist in your area that can help with your home search.
Find a foreclosure agentForeclosure details
Estimated market value
$423,400
$381,000 - $466,000
$2,752/mo
Price history
| Date | Event | Price |
|---|---|---|
| 8/16/2002 | Sold | $148,000$90/sqft |
Source: Public Record Report a problem | ||
Public tax history
| Year | Property taxes | Tax assessment |
|---|---|---|
| 2025 | $1,953 +4.2% | $136,052 +2.9% |
| 2024 | $1,874 +6.1% | $132,218 +3% |
| 2023 | $1,766 +1.7% | $128,367 +3% |
| 2022 | $1,737 +1.6% | $124,628 +3% |
| 2021 | $1,710 +1% | $120,998 +1.4% |
| 2020 | $1,694 +2.9% | $119,327 +2.3% |
| 2019 | $1,646 | $116,644 +1.9% |
| 2018 | $1,646 +3.1% | $114,469 +2.1% |
| 2017 | $1,595 +0.6% | $112,115 -36.3% |
| 2016 | $1,586 | $176,000 +25.4% |
| 2015 | $1,586 +0.4% | $140,300 +31.6% |
| 2014 | $1,580 +0.3% | $106,582 |
| 2013 | $1,575 +2.2% | $106,582 +1.7% |
| 2012 | $1,541 -0.4% | $104,800 -1.6% |
| 2011 | $1,547 -0.2% | $106,500 -7.6% |
| 2010 | $1,550 -14% | $115,300 -14.4% |
| 2009 | $1,802 | $134,700 -4.1% |
| 2008 | $1,802 -4.9% | $140,501 +3% |
| 2007 | $1,895 | $136,409 +3.3% |
| 2006 | -- | $132,106 +3% |
| 2005 | -- | $128,258 +3% |
| 2004 | $1,928 -0.8% | $124,522 +1.9% |
| 2003 | $1,944 +42.8% | $122,200 +52.8% |
| 2002 | $1,361 +6% | $79,952 +1.6% |
| 2001 | $1,284 +2.3% | $78,693 +3% |
| 2000 | $1,256 | $76,401 |
Find assessor info on the county website
Monthly payment
Estimated monthly payment$1,822
All calculations are estimates and provided by Zillow, Inc. for informational purposes only. Actual amounts may vary.
HOA fees may include property taxes on listings classified as Co-Ops. Contact the listing agent and/or owner for fee details.
Mortgage interest rates are dependent on a number of factors, including credit score, down payment, and repayment length. Interest rate data provided by Zillow Group Marketplace, Inc. as of 1/1/1970 from various mortgage lenders with which we have lead or other similar arrangements; the Estimated Payment is an average of those rates.
See how much you could borrow to make a competitive offer.
Climate risks
Neighborhood: Southgate
Nearby schools
GreatSchools rating
- 10/10Southside Elementary SchoolGrades: K-5Distance: 1 mi
- 6/10Brookside Middle SchoolGrades: 6-8Distance: 0.7 mi
- 5/10Sarasota High SchoolGrades: 9-12Distance: 1.3 mi


- Florida
- Sarasota County
- Sarasota
- 34239
- Southgate
- 2630 Webber St
Nearby cities
Nearby neighborhoods
Nearby zip codes
Other Sarasota Topics
