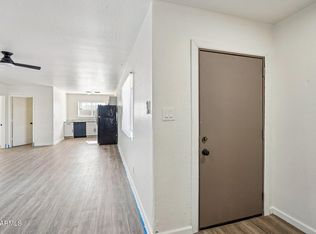
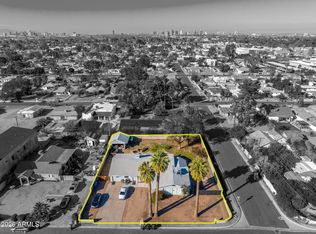
Don't miss out on this Well-Maintained Triplex w/ Three Large 2-Bedroom, 1-Bath Units. Each Tenant has their own W/D hookupsl Well Maintained and updated as needed. Each unit has Kitchens Equipped with Range, Refrigerator & Hood Packages. Conveniently located near freeways, shopping, and dining. Ample parking with a convenient layout. The area is growing. Don't miss out!!
For sale
$539,000
2903 E WIER Avenue, Phoenix, AZ 85040
6beds
3baths
2,196sqft
Multi Family
Built in 1984
-- sqft lot
$-- Zestimate®
$245/sqft
$-- HOA
What's special
- 22 days
- 68
- 8
Zillow last checked:
Listing updated:
Listed by:
Richard Horst 480-353-0394,
Keller Williams Arizona Realty
Source: ARMLS,MLS#: 7090141
Facts & features
Interior
Bedrooms & bathrooms
- Bedrooms: 6
- Bathrooms: 3
Heating
- Electric
Cooling
- Ceiling Fan(s), Electric, Heat Pump
Appliances
- Included: Free-Standing Range, Refrigerator
- Laundry: W/D Hookup
Features
- Flooring: Ceramic Tile
Interior area
- Total structure area: 2,196
- Total interior livable area: 2,196 sqft
Property
Parking
- Total spaces: 5
- Parking features: Paved, Free, 1 Space/Unit
- Uncovered spaces: 5
Lot
- Dimensions: 57.97 x 127.77 x 57.96 x 127.78
Details
- Parcel number: 12261011A
- Zoning: R-3
Construction
Type & style
- Home type: MultiFamily
- Property subtype: Multi Family
Materials
- Painted, Block
- Roof: Composition
Condition
- Year built: 1984
Utilities & green energy
- Electric: SRP, Individual Meter
- Water: City Franchise
- Utilities for property: Sewer Connected
Community & HOA
Community
- Features: No Pool
- Subdivision: WIER ESTATES LOTS 11-32 53-74
Location
- Region: Phoenix
Financial & listing details
- Price per square foot: $245/sqft
- Tax assessed value: $351,700
- Annual tax amount: $786
- Date on market: 9/30/2026
- Listing terms: VA Loan,Cash,Conventional,1031 Exchange,FHA
- Ownership: Fee Simple
- Electric utility on property: Yes
- Road surface type: Asphalt
Estimated market value
Not available
Estimated sales range
Not available
Not available
Price history
| Date | Event | Price |
|---|---|---|
| 10/6/2026 | Listed for sale | $539,000+1.5%$245/sqft |
Source:  ARMLS #7090141 Report a problem | ||
| 5/14/2026 | Listing removed | $531,000$242/sqft |
Source: ARMLS #6944368 Report a problem | ||
| 2/6/2026 | Price change | $531,000+1.3%$242/sqft |
Source: ARMLS #6944368 Report a problem | ||
| 1/26/2026 | Listed for sale | $524,000$239/sqft |
Source: ARMLS #6944368 Report a problem | ||
| 1/12/2026 | Listing removed | $524,000$239/sqft |
Source: ARMLS #6944368 Report a problem | ||
| 12/30/2025 | Price change | $524,000-2.1%$239/sqft |
Source: ARMLS #6944368 Report a problem | ||
| 11/8/2025 | Listed for sale | $535,000+10.5%$244/sqft |
Source: ARMLS #6944368 Report a problem | ||
| 12/22/2023 | Sold | $484,000-3%$220/sqft |
Source: ARMLS #6587498 Report a problem | ||
| 11/22/2023 | Pending sale | $499,000$227/sqft |
Source: ARMLS #6587498 Report a problem | ||
| 9/20/2023 | Price change | $499,000-5.7%$227/sqft |
Source: ARMLS #6587498 Report a problem | ||
| 9/4/2023 | Listed for sale | $529,000$241/sqft |
Source: ARMLS #6587498 Report a problem | ||
| 8/28/2023 | Pending sale | $529,000$241/sqft |
Source: ARMLS #6587498 Report a problem | ||
| 8/9/2023 | Listed for sale | $529,000$241/sqft |
Source: ARMLS #6587498 Report a problem | ||
| 8/5/2023 | Pending sale | $529,000$241/sqft |
Source: ARMLS #6587498 Report a problem | ||
| 8/2/2023 | Listed for sale | $529,000+763%$241/sqft |
Source: ARMLS #6587498 Report a problem | ||
| 12/31/2012 | Sold | $61,300-70.4%$28/sqft |
Source: Public Record Report a problem | ||
| 11/22/2005 | Sold | $207,000+20.3%$94/sqft |
Source: ARMLS #2388485 Report a problem | ||
| 7/18/2005 | Sold | $172,000+29.3%$78/sqft |
Source: Public Record Report a problem | ||
| 6/5/2003 | Sold | $133,000+504.5%$61/sqft |
Source: Public Record Report a problem | ||
| 4/30/1998 | Sold | $22,000+12.8%$10/sqft |
Source: Public Record Report a problem | ||
| 11/21/1994 | Sold | $19,500$9/sqft |
Source: Public Record Report a problem | ||
Public tax history
| Year | Property taxes | Tax assessment |
|---|---|---|
| 2025 | $786 +2.6% | $35,170 -8.2% |
| 2024 | $766 +2.9% | $38,320 +709.8% |
| 2023 | $745 +2.1% | $4,732 -78.4% |
| 2022 | $729 -0.8% | $21,860 +21.8% |
| 2021 | $735 +3.3% | $17,950 +23.3% |
| 2020 | $711 +2.8% | $14,560 +0.8% |
| 2019 | $692 | $14,450 +36.1% |
| 2018 | $692 +4.9% | $10,620 +36.7% |
| 2017 | $660 +11.7% | $7,770 +17.7% |
| 2016 | $591 -3.7% | $6,600 +17.6% |
| 2015 | $613 | $5,610 +32% |
| 2014 | -- | $4,250 +60.4% |
| 2013 | -- | $2,650 -27.8% |
| 2012 | -- | $3,670 -14.8% |
| 2011 | -- | $4,310 -54% |
| 2010 | -- | $9,360 -40.5% |
| 2009 | -- | $15,730 +3.1% |
| 2008 | -- | $15,260 +17.8% |
| 2007 | -- | $12,950 +31.5% |
| 2006 | -- | $9,850 |
| 2005 | -- | $9,850 +33.1% |
| 2004 | -- | $7,400 |
| 2003 | -- | $7,400 +57.4% |
| 2002 | -- | $4,700 |
Find assessor info on the county website
Monthly payment
Est. payment
Payment breakdown
Explore the cost of this home by adjusting the details. Changes won't be saved.Climate risks
Neighborhood: South Mountain
Nearby schools
Schools provided by the listing agent
- Elementary: Percy L Julian School
- Middle: Percy L Julian School
- High: South Mountain High School
- District: Roosevelt Elementary District
Source: ARMLS. This data may not be complete. We recommend contacting the local school district to confirm school assignments for this home.


Similar homes
- $549,9006 bd4 ba2.2k sqft1344 E Pueblo Avenue, Phoenix, AZ 85040For Sale
 MLS ID #7081089, Lenny Behie, Fathom Realty Elite. ARMLS
- $548,0006 bd4 ba3.1k sqft2642 N 31ST Street, Phoenix, AZ 85008For Sale
 MLS ID #6993340, Bruce Swift, Windermere Real Estate & Property Management. ARMLS
- $549,9996 bd3 ba2.3k sqft1132 W NORTH Lane, Phoenix, AZ 85021For Sale
 MLS ID #7042432, Jairo Cruz Perez, RHP Real Estate. ARMLS
- $525,0006 bd3 ba2.4k sqft532 S MESA Drive #B, Mesa, AZ 85210For Sale
 MLS ID #7044313, Kelly Cook, Real Broker. ARMLS
