Nice in-law unit in a very nice area. Close to South Hayward BART, CSU East Bay, shopping, Hwys 84,92, 880 and the whole silicon valley.
Pre-foreclosure
Est. $593,900
29870 Clearbrook Cir, Hayward, CA 94544
1beds
1baths
600sqft
Apartment
Built in 1976
-- sqft lot
$593,900 Zestimate®
$990/sqft
$-- HOA
Overview
- 43 days
- 17
- 0
Facts & features
Interior
Bedrooms & bathrooms
- Bedrooms: 1
- Bathrooms: 1
Heating
- Forced air, Electric
Cooling
- None
Interior area
- Total interior livable area: 600 sqft
Property
Parking
- Parking features: None
Lot
- Size: 1.38 Acres
Details
- Parcel number: 8325453
Construction
Type & style
- Home type: Apartment
Materials
- wood frame
Condition
- Year built: 1976
Community & HOA
Location
- Region: Hayward
Financial & listing details
- Price per square foot: $990/sqft
- Tax assessed value: $530,600
Foreclosure details
Estimated market value
$593,900
$493,000 - $713,000
$2,116/mo
Price history
| Date | Event | Price |
|---|---|---|
| 9/7/2023 | Sold | $500,000$833/sqft |
Source: Public Record Report a problem | ||
| 3/30/2023 | Sold | $500,000-35.5%$833/sqft |
Source: Public Record Report a problem | ||
| 10/18/2020 | Listing removed | $1,850$3/sqft |
Source: Re/Max Gold #40924857 Report a problem | ||
| 10/11/2020 | Listed for rent | $1,850-5.1%$3/sqft |
Source: Re/Max Gold #40924857 Report a problem | ||
| 6/6/2020 | Listing removed | $1,950$3/sqft |
Source: Re/Max Key #40906041 Report a problem | ||
| 5/29/2020 | Price change | $1,950-2.5%$3/sqft |
Source: Re/Max Key #40906041 Report a problem | ||
| 5/26/2020 | Listed for rent | $2,000$3/sqft |
Source: Re/Max Key #40906041 Report a problem | ||
| 9/10/2002 | Sold | $775,000+1862%$1,292/sqft |
Source:  Bay East AOR #11130127 Report a problem | ||
| 8/26/1998 | Sold | $39,500$66/sqft |
Source: Public Record Report a problem | ||
Public tax history
| Year | Property taxes | Tax assessment |
|---|---|---|
| 2026 | -- | $530,600 +2% |
| 2025 | $7,713 +2% | $520,200 +2% |
| 2024 | $7,562 -52.2% | $510,000 -57.9% |
| 2023 | $15,818 +2% | $1,212,700 +2% |
| 2022 | $15,503 +1.7% | $1,188,928 +2% |
| 2021 | $15,239 +7.1% | $1,165,618 +1% |
| 2020 | $14,231 -0.6% | $1,153,669 +2% |
| 2019 | $14,321 +3.3% | $1,131,056 +2% |
| 2018 | $13,859 | $1,108,886 +2% |
| 2017 | $13,859 +1.5% | $1,087,150 +2% |
| 2016 | $13,650 +41.7% | $1,065,840 +47% |
| 2015 | $9,632 +6.1% | $725,000 +11.5% |
| 2014 | $9,081 | $650,000 +8.3% |
| 2013 | -- | $600,000 -27.7% |
| 2012 | -- | $830,000 |
| 2011 | -- | $830,000 -2.4% |
| 2010 | -- | $850,000 -25.2% |
| 2009 | -- | $1,136,540 +2% |
| 2008 | -- | $1,114,258 +2% |
| 2007 | -- | $1,092,418 +2% |
| 2006 | -- | $1,071,000 +33% |
| 2005 | -- | $805,255 +2% |
| 2004 | -- | $789,469 +1.9% |
| 2003 | -- | $775,000 +19.7% |
| 2002 | -- | $647,691 +2% |
| 2001 | $8,068 | $634,989 |
Find assessor info on the county website
Monthly payment
Climate risks
Neighborhood: Mission-Garin
- $1,441,8004 bd3 ba2.9k sqft1190 Silver Maple Ln, Hayward, CA 94544Off Market

- $895,0834 bd3 ba5.3k sqft1191 Silver Maple Ln, Hayward, CA 94544Off Market

- $2,765,6006 bd7 ba6.9k sqft1191 Silver Maple Ln, Hayward, CA 94544Off Market
- $1,815,6005 bd4 ba3.3k sqft1182 Silver Maple Ln, Hayward, CA 94544Off Market
Similar homes
- $600,0002 bd1 ba722 sqft290 Shepherd Ave, Hayward, CA 94544For Sale
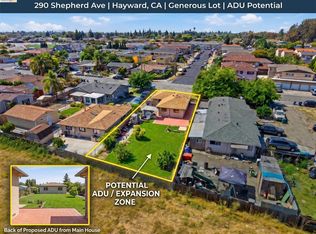 MLS ID #41145200, Gerardo Barron. bridgeMLS/CCAR/Bay East AOR
- $484,9502 bd2 ba894 sqftHayward Hills, Hayward, CA 94544For Sale
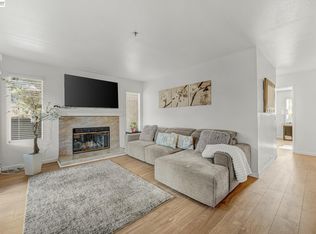 MLS ID #41150437, Christine Rosi. Bay East AOR
- $379,8881 bd1 ba598 sqftBridgeporte, Hayward, CA 94544For Sale
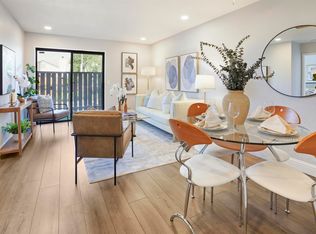 MLS ID #41152155, Jaime Raul Gonzalez. Bay East AOR
- $319,0001 bd1 ba579 sqftThe Oaks, Hayward, CA 94544For Sale
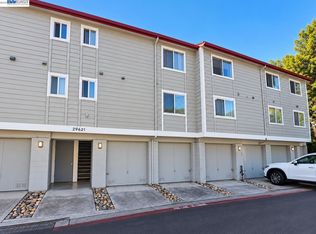 MLS ID #41148889, Dorina Manga. Bay East AOR
