Amazing development opportunity to create the home of your dreams in the heart of the city. Currently a 4,642 sq ft (see plans in public doc's.) 3-family corner row house with 3 exposures abuts the SW Corridor at the South End/ Back Bay border, on a quiet, tree-lined, dead-end street. Permits in place to add an additional 880 sq ft (total of 5,522 sq ft) this home can be transformed into the home of your dreams with 5 bdrms, 5.5 baths, an office, movie theater, roof rights, a 1,436 sq ft terrace, and 2 covered parking spaces. Close proximity to cafes, restaurants, theaters, shopping, playgrounds, dog parks, supermarkets, Rt 90W and all the South End & Back Bay have to offer. Endless possibilities. Seller welcomes offers with requests for compensation.
For sale
$3,995,000
30 Cumberland St, Boston, MA 02115
7beds
4,642sqft
3 Family
Built in 1880
-- sqft lot
$4,229,500 Zestimate®
$861/sqft
$-- HOA
What's special
Quiet tree-lined dead-end street
- 23 days
- 278
- 5
Zillow last checked:
Listing updated:
Listed by:
Brian Perry 617-413-8049,
Gibson Sotheby's International Realty 617-426-6900,
Melissa Chernesky 617-501-7674
Source: MLS PIN,MLS#: 73596669
Facts & features
Interior
Bedrooms & bathrooms
- Bedrooms: 7
- Bathrooms: 4
- Full bathrooms: 3
- 1/2 bathrooms: 1
Features
- Has basement: No
- Number of fireplaces: 2
Interior area
- Total structure area: 4,642
- Total interior livable area: 4,642 sqft
- Finished area above ground: 3,742
- Finished area below ground: 900
Property
Parking
- Total spaces: 3
- Parking features: Paved Drive
- Uncovered spaces: 3
Lot
- Size: 2,130 Square Feet
- Features: Level
Details
- Parcel number: W:04 P:02400 S:000,3362179
- Zoning: R3
Construction
Type & style
- Home type: MultiFamily
- Property subtype: 3 Family
Materials
- Brick
- Foundation: Brick/Mortar
Condition
- Year built: 1880
Utilities & green energy
- Sewer: Public Sewer
- Water: Public
Community & HOA
Community
- Features: Public Transportation, Shopping, Tennis Court(s), Park, Walk/Jog Trails, Laundromat, Bike Path, Conservation Area, Highway Access, House of Worship, T-Station
Location
- Region: Boston
Financial & listing details
- Price per square foot: $861/sqft
- Tax assessed value: $3,622,500
- Annual tax amount: $39,485
- Date on market: 10/29/2026
- Total actual rent: 11300
Estimated market value
$4,229,500
$3.38M - $5.29M
Not available
Price history
| Date | Event | Price |
|---|---|---|
| 10/29/2026 | Listed for sale | $3,995,000$861/sqft |
Source: MLS PIN #73596669 Report a problem | ||
| 9/1/2026 | Listing removed | $3,995,000$861/sqft |
Source: MLS PIN #73343591 Report a problem | ||
| 10/10/2025 | Listed for sale | $3,995,000$861/sqft |
Source: MLS PIN #73343591 Report a problem | ||
| 10/1/2025 | Listing removed | $3,995,000$861/sqft |
Source: MLS PIN #73343591 Report a problem | ||
| 3/10/2025 | Listed for sale | $3,995,000+653.8%$861/sqft |
Source: MLS PIN #73343591 Report a problem | ||
| 3/4/2020 | Listing removed | $2,600$1/sqft |
Source: Zillow Rental Manager Report a problem | ||
| 1/27/2020 | Listed for rent | $2,600+4%$1/sqft |
Source: Zillow Rental Manager Report a problem | ||
| 8/30/2019 | Listing removed | $2,500$1/sqft |
Source: Zillow Rental Manager Report a problem | ||
| 5/20/2019 | Price change | $2,500-3.8%$1/sqft |
Source: Zillow Rental Manager Report a problem | ||
| 2/1/2019 | Listed for rent | $2,600-23.5%$1/sqft |
Source: Zillow Rental Manager Report a problem | ||
| 8/10/2017 | Listing removed | $3,400$1/sqft |
Source: Weichert Realtors - Hudson Morgan Group Report a problem | ||
| 7/14/2017 | Listed for rent | $3,400-2.9%$1/sqft |
Source: Weichert Realtors, Hudson Morgan Group Report a problem | ||
| 6/1/2015 | Listing removed | $3,500$1/sqft |
Source: Owner Report a problem | ||
| 5/30/2015 | Price change | $3,500+12.9%$1/sqft |
Source: Owner Report a problem | ||
| 4/27/2015 | Listed for rent | $3,100$1/sqft |
Source: Gibson and Sotheby's Report a problem | ||
| 5/13/1994 | Sold | $530,000$114/sqft |
Source: Public Record Report a problem | ||
Public tax history
| Year | Property taxes | Tax assessment |
|---|---|---|
| 2025 | $46,392 +17.5% | $4,006,200 +10.6% |
| 2024 | $39,485 +1.5% | $3,622,500 |
| 2023 | $38,906 -1.3% | $3,622,500 |
| 2022 | $39,413 +5% | $3,622,500 +3% |
| 2021 | $37,526 +2% | $3,517,000 +0.9% |
| 2020 | $36,798 +10.2% | $3,484,700 +10% |
| 2019 | $33,389 +7.6% | $3,167,800 +7% |
| 2018 | $31,035 +348.5% | $2,961,400 +8% |
| 2017 | $6,920 -75% | $2,742,500 +9% |
| 2016 | $27,680 +6.8% | $2,516,400 +17.6% |
| 2015 | $25,923 +10.8% | $2,140,600 +15% |
| 2014 | $23,406 +1.7% | $1,860,600 +6.3% |
| 2013 | $23,006 +2.6% | $1,750,800 +1.8% |
| 2012 | $22,426 +9.3% | $1,719,800 +7.2% |
| 2011 | $20,525 +6.6% | $1,604,800 -1% |
| 2010 | $19,257 +11.4% | $1,621,000 -0.4% |
| 2009 | $17,292 -3% | $1,626,700 +0.1% |
| 2008 | $17,823 -1.2% | $1,624,700 -1% |
| 2007 | $18,044 -0.7% | $1,641,900 +0.5% |
| 2006 | $18,166 +8.9% | $1,633,600 +5.1% |
| 2005 | $16,679 +13.1% | $1,554,400 +7% |
| 2004 | $14,745 +8.9% | $1,452,700 +21.2% |
| 2003 | $13,537 +9.2% | $1,199,000 +6.5% |
| 2002 | $12,392 +57.1% | $1,125,500 +87.6% |
| 2000 | $7,887 | $599,800 |
Find assessor info on the county website
Monthly payment
Est. payment
Payment breakdown
Explore the cost of this home by adjusting the details. Changes won't be saved.Climate risks
Neighborhood: Back Bay

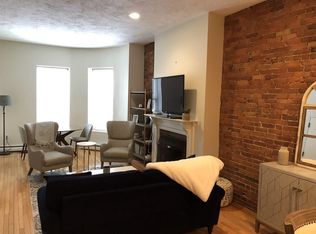


Similar homes
- $4,790,0008 bd7 ba4k sqft426 Marlborough St, Boston, MA 02115For Sale
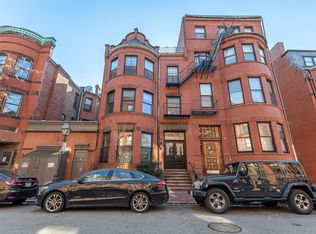 MLS ID #73597754, Valerie Filiberto, A & S Realty Co., Inc.. MLS PIN
- $3,595,0006 bd4 ba3.7k sqft31 Fairfield St, Boston, MA 02116For Sale
 MLS ID #73599176, Jacob Medoff, Centre Realty Group. MLS PIN
- $4,500,0004 bd4 ba2.5k sqft423 Beacon St #2, Boston, MA 02115For Sale
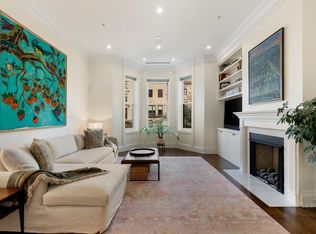 MLS ID #73598711, Hans Nagrath, Compass. MLS PIN
- $4,495,0006 bd10 ba4.9k sqft503 Beacon St, Boston, MA 02215For Sale
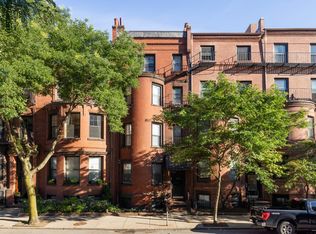 MLS ID #73586460, Kevin Benzinger, Boston Realty Advisors. MLS PIN
