Newly remodeled with fresh paint throughout.
For sale by owner
$590,000
300 Sand Ridge Rd, El Dorado, CA 95623
2beds
2baths
1,760sqft
Unknown
Built in 1982
-- sqft lot
$437,900 Zestimate®
$335/sqft
$-- HOA
What's special
Fresh paint throughout
- 17 days
- 292
- 6
Listed by:
Property Owner (661) 917-3136
Facts & features
Interior
Bedrooms & bathrooms
- Bedrooms: 2
- Bathrooms: 2
Heating
- Forced air, Other, Electric, Propane / Butane, Wood / Pellet
Cooling
- Central
Appliances
- Included: Dishwasher, Microwave, Range / Oven
Features
- Flooring: Hardwood
- Basement: Unfinished
- Has fireplace: Yes
Interior area
- Total interior livable area: 1,760 sqft
Property
Parking
- Total spaces: 8
- Parking features: Carport, Garage - Detached
Features
- Exterior features: Wood, Composition
- Has view: Yes
- View description: Mountain
Lot
- Size: 11.72 Acres
Details
- Parcel number: 092470043000
Construction
Type & style
- Home type: Unknown
Materials
- wood frame
- Roof: Asphalt
Condition
- New construction: No
- Year built: 1982
Community & HOA
Location
- Region: El Dorado
Financial & listing details
- Price per square foot: $335/sqft
- Tax assessed value: $447,372
- Date on market: 10/23/2026
Estimated market value
$437,900
$390,000 - $486,000
Not available
Price history
| Date | Event | Price |
|---|---|---|
| 10/23/2026 | Listed for sale | $590,000+37.2%$335/sqft |
Source: Owner Report a problem | ||
| 4/3/2024 | Sold | $430,000-4.4%$244/sqft |
Source: MetroList Services of CA #223111232 Report a problem | ||
| 2/9/2024 | Pending sale | $449,900$256/sqft |
Source: MetroList Services of CA #223111232 Report a problem | ||
| 11/17/2023 | Listed for sale | $449,900+265.8%$256/sqft |
Source: MetroList Services of CA #223111232 Report a problem | ||
| 1/31/1996 | Sold | $123,000$70/sqft |
Source: Public Record Report a problem | ||
Public tax history
| Year | Property taxes | Tax assessment |
|---|---|---|
| 2026 | -- | $447,372 +2% |
| 2025 | $4,567 +118.9% | $438,600 +118% |
| 2024 | $2,087 +2.1% | $201,230 +2% |
| 2023 | $2,044 +1.5% | $197,286 +2% |
| 2022 | $2,013 +2.3% | $193,419 +2% |
| 2021 | $1,967 +0.5% | $189,627 +1% |
| 2020 | $1,957 +1.6% | $187,683 +2% |
| 2019 | $1,926 +3.1% | $184,004 +2% |
| 2018 | $1,868 +1.9% | $180,397 +2% |
| 2017 | $1,834 +1.4% | $176,860 +2% |
| 2016 | $1,809 +6% | $173,393 +2% |
| 2015 | $1,706 | $169,994 +2% |
| 2014 | $1,706 | $166,667 +0.5% |
| 2013 | -- | $165,915 +4% |
| 2012 | -- | $159,474 |
| 2011 | -- | $159,474 +0.8% |
| 2010 | -- | $158,283 -0.2% |
| 2009 | -- | $158,662 +2% |
| 2008 | -- | $155,552 +2% |
| 2007 | -- | $152,503 +2% |
| 2006 | -- | $149,514 +2% |
| 2005 | -- | $146,583 +2% |
| 2004 | -- | $143,710 +1.9% |
| 2003 | -- | $141,078 +2% |
| 2002 | -- | $138,313 +2% |
| 2001 | -- | $135,602 +2% |
| 2000 | -- | $132,944 |
Find assessor info on the county website
Monthly payment
Est. payment
Payment breakdown
Explore the cost of this home by adjusting the details. Changes won't be saved.Climate risks
Neighborhood: 95623
Similar homes
- $669,9003 bd2 ba1.9k sqft7372 Mica St, El Dorado, CA 95623For Sale
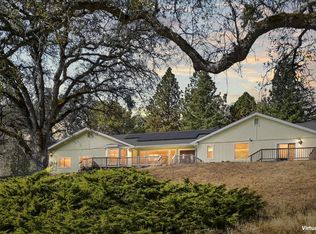 MLS ID #226126344, Jayce Bieber. MetroList Services of CA
- $575,0003 bd2 ba1.3k sqft2501 Freshwater Ln, El Dorado, CA 95623For Sale
 MLS ID #226103644, Kelsey Wirt. MetroList Services of CA
- $599,0003 bd2 ba1.6k sqft6013 Dolomite Dr, El Dorado, CA 95623For Sale
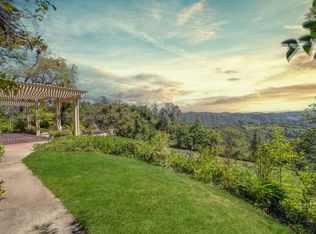 MLS ID #226117260, Samuel Weiner. MetroList Services of CA
- $599,0004 bd2 ba2.4k sqft5720 Jasper Ct, El Dorado, CA 95623For Sale
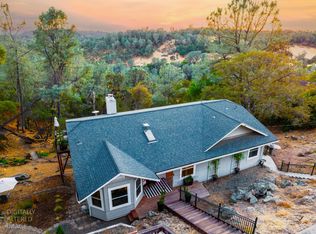 MLS ID #226112462, Aaron Work. MetroList Services of CA
Local buyer's agents are ready to help
