Investor opportunity in West Tampa. This 7-bedroom, 3-bath single-family home offers approximately 2,970 square feet and has been recently updated. The property is presently generating approximately $4,200 per month in gross rental income, with current utility expenses average approximately $800 per month. Conveniently located in West Tampa with access to I-275, Downtown Tampa, Tampa International Airport, the Westshore business district, shopping, dining and major employment centers. Schedule your showing today to see this spacious Tampa home!
For sale
Price cut: $26K (11/10)
$549,000
3001 W CHESTNUT STREET, TAMPA, FL 33607
6beds
2,970sqft
Single Family Residence
Built in 1930
6,175 Square Feet Lot
$-- Zestimate®
$185/sqft
$-- HOA
What's special
Recently updatedSpacious tampa home
- 45 days
- 584
- 50
Zillow last checked:
Listing updated:
Listed by:
Alfonso DiGirolamo 610-348-9717,
DIGI REALTY GROUP, INC. 610-348-9717,
Chris Auletta 727-334-7575,
DIGI REALTY GROUP, INC.
Source: Stellar MLS,MLS#: TB8551830 Originating MLS: Suncoast Tampa
Facts & features
Interior
Bedrooms & bathrooms
- Bedrooms: 6
- Bathrooms: 3
- Full bathrooms: 3
Primary bedroom
- Features: Built-in Closet
- Level: Second
- Area: 240 Square Feet
- Dimensions: 15x16
Other
- Features: Built-in Closet
- Level: First
- Area: 210 Square Feet
- Dimensions: 14x15
Other
- Features: Built-in Closet
- Level: First
- Area: 196 Square Feet
- Dimensions: 14x14
Bathroom 1
- Level: First
Bathroom 2
- Level: First
Bathroom 3
- Level: First
Kitchen
- Level: First
Living room
- Level: First
- Area: 450 Square Feet
- Dimensions: 30x15
Heating
- Electric
Cooling
- Central Air
Appliances
- Included: Microwave, Range, Refrigerator
- Laundry: In Kitchen
Features
- Ceiling Fan(s)
- Flooring: Luxury Vinyl
- Has fireplace: No
- Furnished: Yes
Interior area
- Total structure area: 1,226
- Total interior livable area: 2,970 sqft
Video & virtual tour
Property
Features
- Levels: Multi/Split
- Exterior features: Rain Gutters
Lot
- Size: 6,175 Square Feet
Details
- Parcel number: A1529184PV00005300032.0
- Zoning: RS-50
- Special conditions: None
Construction
Type & style
- Home type: SingleFamily
- Property subtype: Single Family Residence
Materials
- Vinyl Siding
- Foundation: Slab
- Roof: Shingle
Condition
- New construction: No
- Year built: 1930
Utilities & green energy
- Sewer: Public Sewer
- Water: Public
- Utilities for property: Electricity Connected, Sewer Connected, Water Connected
Community & HOA
Community
- Pet fee: $0 monthly
- Subdivision: MAC FARLANE PARK
HOA
- Has HOA: No
Location
- Region: Tampa
Financial & listing details
- Price per square foot: $185/sqft
- Tax assessed value: $399,123
- Annual tax amount: $8,091
- Date on market: 10/3/2026
- Cumulative days on market: 45 days
- Listing terms: Cash,Conventional,FHA,USDA Loan,VA Loan
- Ownership: Fee Simple
- Total actual rent: 0
- Electric utility on property: Yes
- Road surface type: Asphalt
Estimated market value
Not available
Estimated sales range
Not available
Not available
Price history
| Date | Event | Price |
|---|---|---|
| 11/10/2026 | Price change | $549,000-4.5%$185/sqft |
Source:  Stellar MLS #TB8551830 Report a problem | ||
| 10/3/2026 | Listed for sale | $575,000+4.6%$194/sqft |
Source: Stellar MLS #TB8551830 Report a problem | ||
| 3/31/2025 | Listing removed | $549,900$185/sqft |
Source: Stellar MLS #TB8351925 Report a problem | ||
| 2/18/2025 | Listed for sale | $549,900+82.6%$185/sqft |
Source: Stellar MLS #TB8351925 Report a problem | ||
| 11/6/2024 | Listing removed | $2,100$1/sqft |
Source: Zillow Rentals Report a problem | ||
| 10/20/2024 | Listed for rent | $2,100+68%$1/sqft |
Source: Zillow Rentals Report a problem | ||
| 12/9/2022 | Listing removed | -- |
Source: Zillow Rentals Report a problem | ||
| 12/8/2022 | Price change | $1,250-51.9% |
Source: Zillow Rentals Report a problem | ||
| 11/17/2022 | Listed for rent | $2,600$1/sqft |
Source: Zillow Rental Manager Report a problem | ||
| 8/24/2022 | Listing removed | -- |
Source: Zillow Rental Manager Report a problem | ||
| 7/12/2022 | Price change | $2,600-7.1%$1/sqft |
Source: Zillow Rental Manager Report a problem | ||
| 6/23/2022 | Listed for rent | $2,800$1/sqft |
Source: Zillow Rental Manager Report a problem | ||
| 6/7/2022 | Sold | $301,087-4.4%$101/sqft |
Source: Public Record Report a problem | ||
| 6/2/2022 | Listing removed | -- |
Source: Zillow Rental Manager Report a problem | ||
| 5/3/2022 | Listed for rent | $2,800+19.1%$1/sqft |
Source: Zillow Rental Manager Report a problem | ||
| 1/24/2022 | Listing removed | -- |
Source: Zillow Rental Manager Report a problem | ||
| 12/25/2021 | Listed for rent | $2,350$1/sqft |
Source: Zillow Rental Manager Report a problem | ||
| 4/13/2020 | Listing removed | $315,000$106/sqft |
Source: DALTON WADE INC #U8073258 Report a problem | ||
| 4/3/2020 | Pending sale | $315,000$106/sqft |
Source: DALTON WADE INC #U8073258 Report a problem | ||
| 3/12/2020 | Price change | $315,000-3.1%$106/sqft |
Source: DALTON WADE INC #U8073258 Report a problem | ||
| 2/26/2020 | Pending sale | $325,000$109/sqft |
Source: DALTON WADE INC #U8073258 Report a problem | ||
| 1/31/2020 | Listed for sale | $325,000-1.5%$109/sqft |
Source: DALTON WADE INC #U8073258 Report a problem | ||
| 5/31/2019 | Listing removed | $330,000$111/sqft |
Source: Keller Williams Realty #U8046662 Report a problem | ||
| 5/29/2019 | Listed for sale | $330,000$111/sqft |
Source: KELLER WILLIAMS REALTY #U8046662 Report a problem | ||
| 4/2/2019 | Listing removed | $330,000$111/sqft |
Source: Keller Williams Realty #U8037295 Report a problem | ||
| 3/7/2019 | Listed for sale | $330,000+302.4%$111/sqft |
Source: KELLER WILLIAMS REALTY #U8037295 Report a problem | ||
| 8/18/2015 | Sold | $82,000$28/sqft |
Source: Public Record Report a problem | ||
Public tax history
| Year | Property taxes | Tax assessment |
|---|---|---|
| 2025 | $8,091 +4.1% | $399,123 |
| 2024 | $7,772 +7.7% | $399,123 +8.7% |
| 2023 | $7,218 +40% | $367,066 +58.4% |
| 2022 | $5,156 +18.9% | $231,769 +15.1% |
| 2021 | $4,338 +11.1% | $201,417 +10% |
| 2020 | $3,906 +7.5% | $183,106 +10% |
| 2019 | $3,632 | $166,460 -5.4% |
| 2018 | $3,632 +7.5% | $175,901 +15.9% |
| 2017 | $3,379 +10.6% | $151,776 +21.4% |
| 2016 | $3,056 +14% | $125,064 +79.4% |
| 2015 | $2,681 +283% | $69,712 +0.8% |
| 2014 | $700 | $69,159 +1.5% |
| 2013 | $700 -1.2% | $68,137 +1.7% |
| 2012 | $709 -6.7% | $66,998 -8.5% |
| 2011 | $759 -0.1% | $73,203 -2% |
| 2010 | $760 +1.3% | $74,692 +2.7% |
| 2009 | $750 -0.5% | $72,728 +0.1% |
| 2008 | $754 -25.4% | $72,655 +3% |
| 2007 | $1,012 -32.3% | $70,539 -19.1% |
| 2006 | $1,494 +0.8% | $87,197 +2.7% |
| 2005 | $1,482 | $84,873 +3% |
| 2004 | -- | $82,401 +1.9% |
| 2003 | -- | $80,865 +2.4% |
| 2002 | -- | $78,970 +1.6% |
| 2001 | -- | $77,726 -30.2% |
| 2000 | $1,174 | $111,314 |
Find assessor info on the county website
Monthly payment
Est. payment
Payment breakdown
Explore the cost of this home by adjusting the details. Changes won't be saved.Climate risks
Neighborhood: Northeast Macfarlane

Similar homes
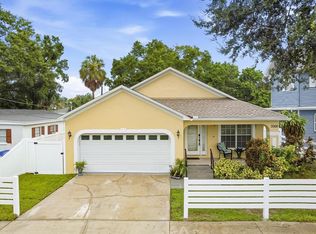
- $525,0004 bd3 ba1.7k sqft2526 W UNION STREET, TAMPA, FL 33607For Sale
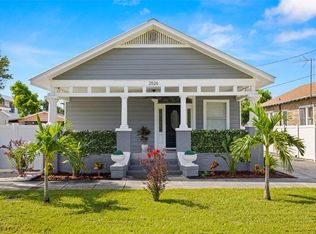
 MLS ID #TB8512110, Amy Greenfield, KELLER WILLIAMS TAMPA CENTRAL. Stellar MLS
- $549,9003 bd2 ba1.7k sqft4611 W PAXTON AVENUE, TAMPA, FL 33611For Sale
 MLS ID #TB8566728, Syed Hasan, EXECUTIVE HOME REALTY INC. Stellar MLS
- $539,0004 bd3 ba2.3k sqft6920 N CAMERON AVENUE, TAMPA, FL 33614For Sale
 MLS ID #TB8530119, Mylena Ruiz Medina, FRIENDS REALTY LLC. Stellar MLS
- $550,0004 bd3 ba1.6k sqft3612 W LEILA AVENUE, TAMPA, FL 33611For Sale
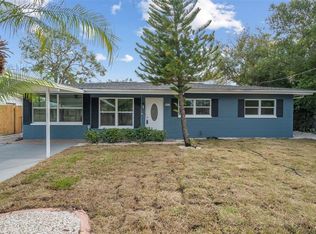 MLS ID #TB8563323, Cathy Medina Ozoria, BHHS FLORIDA PROPERTIES GROUP. Stellar MLS
- $489,0005 bd3 ba2.3k sqft6020 N FLORA VISTA AVENUE, TAMPA, FL 33604For SaleMLS ID #TB8531584, Andrew Duncan, LPT REALTY LLC. Stellar MLS
- $475,0004 bd3 ba2.2k sqft4710 TRAVERTINE DRIVE, TAMPA, FL 33615For SaleMLS ID #TB8533689, Taylor Cresswell, SELLSTATE COASTAL REALTY. Stellar MLS
- $425,0006 bd2 ba1.8k sqft4103 N HOWARD AVENUE, TAMPA, FL 33607For SaleMLS ID #TB8478655, Eric Dungy, COMPASS FLORIDA LLC. Stellar MLS
- $445,0003 bd2 ba1.5k sqft4203 N SUWANEE AVENUE, TAMPA, FL 33603For SaleMLS ID #TB8560472, Joel Zentkovich, LPT REALTY, LLC. Stellar MLS
- $515,0004 bd3 ba2.1k sqft8331 W POCAHONTAS AVENUE, TAMPA, FL 33615For SaleMLS ID #TB8562571, Breisy Loforte, COLDWELL BANKER REALTY. Stellar MLS
- $699,0007 bd4 ba3.2k sqft6711 RALSTON BEACH CIRCLE, TAMPA, FL 33614For SaleMLS ID #TB8561215, Keith Daniels, BROOKS REALTY GROUP LLC. Stellar MLS
- $499,0006 bd3 ba1.9k sqft2609 S 67TH STREET, TAMPA, FL 33619For SaleMLS ID #TB8543197, Mariana Murillo Carvajal, COMPASS FLORIDA LLC. Stellar MLS
- $540,0006 bd2 ba2.4k sqft1124 KING ARTHUR COURT, VALRICO, FL 33594For SaleMLS ID #TB8525672, Jenny Martinez, KELLER WILLIAMS TAMPA CENTRAL. Stellar MLS
- $495,0004 bd3 ba2k sqft4204 S RENELLIE DRIVE, TAMPA, FL 33611For SaleMLS ID #O6422282, Candace Garber, TRUDEALS REALTY CORP. Stellar MLS
- $505,9004 bd3 ba2.6k sqft8903 CAMINO VILLA, TAMPA, FL 33635For SaleMLS ID #TB8536228, Ingrid Sainz, AVENUE HOMES LLC. Stellar MLS
- $399,0004 bd3 ba1.7k sqft1411 E 24TH AVENUE, TAMPA, FL 33605For SaleMLS ID #TB8563069, Chelsea Zaharko, CENTURY 21 LIST WITH BEGGINS. Stellar MLS
- $479,9004 bd3 ba2.2k sqft3906 SPENCE AVENUE, TAMPA, FL 33614For SaleMLS ID #TB8513416, Marileidy Garcia Diaz, AVENUE HOMES LLC. Stellar MLS
- $450,0003 bd3 ba1.5k sqft102 W NORTH STREET, TAMPA, FL 33604For SaleMLS ID #TB8520111, Chandler Thompson, FRANK ALBERT REALTY. Stellar MLS
- $524,9995 bd3 ba2.2k sqft414 JOYCE AVENUE, TEMPLE TERRACE, FL 33617For SaleMLS ID #TB8506835, Richard Brito, TAMPA PROPERTY MANAGERS LLC. Stellar MLS
- $655,0006 bd6 ba3.4k sqft2017 S VILLAGE AVENUE, TAMPA, FL 33612For SaleMLS ID #TB8538804, Siobhan Holcomb, KELLER WILLIAMS SOUTH TAMPA. Stellar MLS
- $564,0006 bd4 ba2.8k sqft1101 81ST AVENUE N, ST PETERSBURG, FL 33702For SaleMLS ID #TB8425001, Kyle Sasser LLC, CHARLES RUTENBERG REALTY INC. Stellar MLS
