Welcome to this excellent opportunity to own a multifamily property in the heart of Leominster!This property features a fully updated kitchen and bathrooms, offering comfort and great value. Each unit offers a spacious layout with 3 bedrooms, making it an excellent opportunity for investors or owner-occupants.?? Great location, close to local amenities, shopping, restaurants, and more!?? Whether you’re looking to expand your investment portfolio or live in one unit while generating rental income from the other, this property offers tremendous potential.?? Don’t miss this opportunity! Schedule your showing today.
For sale
$630,000
346 Central St, Leominster, MA 01453
5beds
2,324sqft
Multi Family
Built in 1900
-- sqft lot
$621,800 Zestimate®
$271/sqft
$-- HOA
What's special
- 8 days
- 198
- 10
Zillow last checked:
Listing updated:
Listed by:
Anderson De Andrade 857-222-7195,
Invest Realty Group 617-306-0134
Source: MLS PIN,MLS#: 73596156
Facts & features
Interior
Bedrooms & bathrooms
- Bedrooms: 5
- Bathrooms: 2
- Full bathrooms: 2
Features
- Basement: Full
- Has fireplace: No
Interior area
- Total structure area: 2,324
- Total interior livable area: 2,324 sqft
- Finished area above ground: 2,324
Property
Parking
- Total spaces: 4
- Parking features: Paved Drive, Off Street
- Uncovered spaces: 4
Features
- Patio & porch: Porch
Lot
- Size: 0.32 Acres
Details
- Parcel number: M:0106 B:0002 L:0000,1579188
- Zoning: C
Construction
Type & style
- Home type: MultiFamily
- Property subtype: Multi Family
Materials
- Frame
- Foundation: Stone
- Roof: Slate
Condition
- Year built: 1900
Utilities & green energy
- Sewer: Public Sewer
- Water: Public
Community & HOA
Community
- Features: Public Transportation, Shopping, Park, Medical Facility, Highway Access, Public School
Location
- Region: Leominster
Financial & listing details
- Price per square foot: $271/sqft
- Tax assessed value: $494,500
- Annual tax amount: $6,755
- Date on market: 10/27/2026
- Total actual rent: 4600
Estimated market value
$621,800
$591,000 - $653,000
$2,328/mo
Price history
| Date | Event | Price |
|---|---|---|
| 10/28/2026 | Listed for sale | $630,000+24.8%$271/sqft |
Source: MLS PIN #73596156 Report a problem | ||
| 3/28/2024 | Sold | $505,000+6.3%$217/sqft |
Source: MLS PIN #73203459 Report a problem | ||
| 2/27/2024 | Contingent | $474,900$204/sqft |
Source: MLS PIN #73203459 Report a problem | ||
| 2/19/2024 | Listed for sale | $474,900+39.7%$204/sqft |
Source: MLS PIN #73203459 Report a problem | ||
| 12/18/2023 | Sold | $340,000+125.2%$146/sqft |
Source: Public Record Report a problem | ||
| 6/29/2000 | Sold | $151,000+297.4%$65/sqft |
Source: Public Record Report a problem | ||
| 8/30/1994 | Sold | $38,000$16/sqft |
Source: Public Record Report a problem | ||
Public tax history
| Year | Property taxes | Tax assessment |
|---|---|---|
| 2025 | $6,619 +11.3% | $471,800 +15.1% |
| 2024 | $5,948 +4.9% | $409,900 +12.3% |
| 2023 | $5,672 +5% | $365,000 +11.9% |
| 2022 | $5,402 +6% | $326,200 +16% |
| 2021 | $5,096 +0.8% | $281,100 |
| 2020 | $5,054 +9.8% | $281,100 +13.2% |
| 2019 | $4,605 +2.8% | $248,400 +7.2% |
| 2018 | $4,481 +20.2% | $231,800 +22.7% |
| 2017 | $3,727 +4.9% | $188,900 +4.1% |
| 2016 | $3,554 +5.9% | $181,500 +5.2% |
| 2015 | $3,355 +2.5% | $172,600 -0.4% |
| 2014 | $3,274 +3.2% | $173,300 -1.9% |
| 2013 | $3,174 +6.3% | $176,700 -1.1% |
| 2012 | $2,986 +4.2% | $178,600 -4% |
| 2011 | $2,866 -4.6% | $186,000 -14.4% |
| 2010 | $3,004 -3.9% | $217,400 -16.3% |
| 2009 | $3,125 +11.7% | $259,800 +4.5% |
| 2008 | $2,797 +5% | $248,600 +1.5% |
| 2007 | $2,665 +5.8% | $244,900 +4.9% |
| 2006 | $2,519 -8.1% | $233,500 +0.2% |
| 2005 | $2,740 +12% | $233,000 +20.5% |
| 2004 | $2,447 +22.5% | $193,300 +25.8% |
| 2003 | $1,998 +1.9% | $153,700 +10.4% |
| 2002 | $1,960 +15.7% | $139,200 +42.6% |
| 1995 | $1,694 | $97,600 |
Find assessor info on the county website
Monthly payment
Est. payment
Payment breakdown
Explore the cost of this home by adjusting the details. Changes won't be saved.Climate risks
Neighborhood: 01453

Similar homes
- $610,0005 bd2 ba1.9k sqft206 Union St, Leominster, MA 01453For Sale
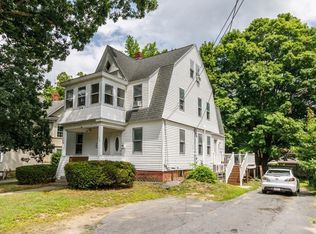 MLS ID #73555883, Stephanie Pandiscio, Foster-Healey Real Estate. MLS PIN
- $570,0006 bd2 ba1.5k sqft282 Lancaster St, Leominster, MA 01453For Sale
 MLS ID #73594393, Pablo Maia, Pablo Maia Realty. MLS PIN
- $585,0003 bd2 ba2.2k sqft420 Grant St, Leominster, MA 01453For Sale
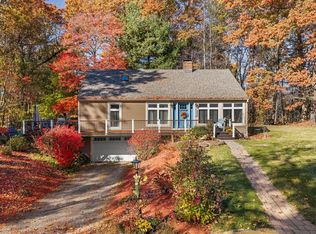 MLS ID #73598546, Doreen Lewis, Redfin Corp.. MLS PIN
- $619,9003 bd2 ba2.5k sqft99 Country Ln, Leominster, MA 01453For Sale
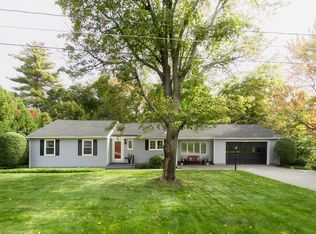 MLS ID #73598683, Laurie Howe Bourgeois, Coldwell Banker Realty - Leominster. MLS PIN
