Investor opportunity. Easy addition to your portfolio, tenants already in place.
Active
Listed by: EXP Realty, LLC • Noah G Steinbaum • 314-607-3259
Price cut: $10K (10/15)
$240,000
3523 Cherokee St, Saint Louis, MO 63118
4beds
2baths
2,116sqft
Multi Family
Built in 1915
-- sqft lot
$239,500 Zestimate®
$113/sqft
$-- HOA
What's special
- 42 days
- 215
- 31
Zillow last checked:
Listing updated:
Listed by:
Noah G Steinbaum 314-607-3259,
EXP Realty, LLC
Source: MARIS,MLS#: 26062570 Originating MLS: St. Louis Association of REALTORS
Facts & features
Interior
Bedrooms & bathrooms
- Bedrooms: 4
- Bathrooms: 2
Heating
- Forced Air, Natural Gas
Cooling
- Central Air, Electric
Features
- Has fireplace: No
Interior area
- Total structure area: 2,116
- Total interior livable area: 2,116 sqft
- Finished area above ground: 2,116
Property
Lot
- Size: 3,841 Square Feet
Details
- Parcel number: 14940002200
- Special conditions: Standard
Construction
Type & style
- Home type: MultiFamily
- Architectural style: Traditional
- Property subtype: Multi Family
Materials
- Brick
Condition
- Year built: 1915
Utilities & green energy
- Electric: Other
- Water: Public
Community & HOA
Community
- Subdivision: Tower Grove Heights
HOA
- Has HOA: No
Location
- Region: Saint Louis
Financial & listing details
- Price per square foot: $113/sqft
- Tax assessed value: $29,360
- Annual tax amount: $2,432
- Date on market: 10/1/2026
- Cumulative days on market: 42 days
- Listing terms: Cash,Conventional
- Ownership: Private
Estimated market value
$239,500
$228,000 - $251,000
$1,101/mo
Price history
| Date | Event | Price |
|---|---|---|
| 10/15/2026 | Price change | $240,000-4%$113/sqft |
Source:  MARIS #26062570 Report a problem | ||
| 10/2/2026 | Listed for sale | $250,000-5.6%$118/sqft |
Source: MARIS #26062570 Report a problem | ||
| 2/1/2026 | Listing removed | $264,900$125/sqft |
Source: MARIS #25075455 Report a problem | ||
| 11/13/2025 | Listed for sale | $264,900-5.4%$125/sqft |
Source: MARIS #25075455 Report a problem | ||
| 7/16/2025 | Listing removed | $280,000$132/sqft |
Source: MARIS #25023187 Report a problem | ||
| 6/17/2025 | Price change | $280,000-1.8%$132/sqft |
Source: MARIS #25023187 Report a problem | ||
| 6/3/2025 | Price change | $285,000-3.4%$135/sqft |
Source: MARIS #25023187 Report a problem | ||
| 5/14/2025 | Price change | $295,000-1.3%$139/sqft |
Source: MARIS #25023187 Report a problem | ||
| 4/15/2025 | Price change | $299,000-0.3%$141/sqft |
Source: MARIS #25023187 Report a problem | ||
| 1/8/2025 | Price change | $299,900-3.3%$142/sqft |
Source: MARIS #24073510 Report a problem | ||
| 12/6/2024 | Listed for sale | $310,000+3.4%$147/sqft |
Source: MARIS #24073510 Report a problem | ||
| 5/26/2022 | Sold | -- |
Source: MARIS #22021054 Report a problem | ||
| 4/27/2022 | Pending sale | $299,900$142/sqft |
Source: MARIS #22021054 Report a problem | ||
| 4/26/2022 | Listed for sale | $299,900$142/sqft |
Source: MARIS #22021054 Report a problem | ||
| 4/19/2022 | Pending sale | $299,900$142/sqft |
Source: MARIS #22021054 Report a problem | ||
| 4/14/2022 | Listed for sale | $299,900$142/sqft |
Source: MARIS #22021054 Report a problem | ||
Public tax history
| Year | Property taxes | Tax assessment |
|---|---|---|
| 2025 | $2,432 +174.2% | $29,360 +186.2% |
| 2024 | $887 +5% | $10,260 |
| 2023 | $845 +9% | $10,260 +13.5% |
| 2022 | $775 +0.1% | $9,040 |
| 2021 | $774 +3.5% | $9,040 +2.5% |
| 2020 | $748 | $8,820 |
| 2019 | $748 | $8,820 +19.8% |
| 2018 | $748 +15.6% | $7,360 +0.1% |
| 2017 | $647 -3.9% | $7,350 -4.5% |
| 2016 | $673 +10% | $7,700 |
| 2015 | $612 +0.8% | $7,700 |
| 2014 | $607 | $7,700 +0.8% |
| 2013 | $607 | $7,640 -20.7% |
| 2012 | -- | $9,640 |
| 2011 | -- | $9,640 |
| 2010 | -- | $9,640 -13.6% |
| 2009 | $770 +5.2% | $11,160 |
| 2008 | $732 | $11,160 -13.8% |
| 2007 | $732 | $12,940 |
| 2006 | $732 +1% | $12,940 +28.5% |
| 2005 | $725 +12.1% | $10,070 +18.9% |
| 2004 | $646 +2.9% | $8,470 |
| 2003 | $628 +10.1% | $8,470 +13.4% |
| 2002 | $570 | $7,470 |
| 2001 | -- | $7,470 +2.6% |
| 2000 | -- | $7,280 |
Find assessor info on the county website
Monthly payment
Est. payment
Payment breakdown
Explore the cost of this home by adjusting the details. Changes won't be saved.Climate risks
Neighborhood: Tower Grove East
Nearby schools
Schools provided by the listing agent
- Elementary: Froebel Elem.
- Middle: Fanning Middle Community Ed.
- High: Roosevelt High
Source: MARIS. This data may not be complete. We recommend contacting the local school district to confirm school assignments for this home.


Similar homes
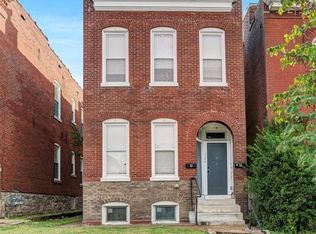
- $249,9004 bd2 ba2.1k sqft3537 Minnesota Ave, Saint Louis, MO 63118For Sale

 MLS ID #26064670, Yuliana A Erazo Hidalgo, Real Broker LLC. MARIS
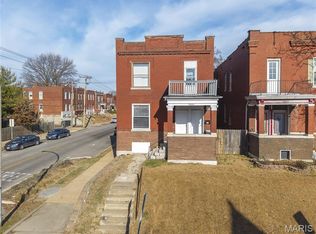
- $225,0004 bd3 ba1.7k sqft3104 Wyoming St, Saint Louis, MO 63118For Sale
 MLS ID #26055829, Tammy K Derrigan, Worth Clark Realty. MARIS
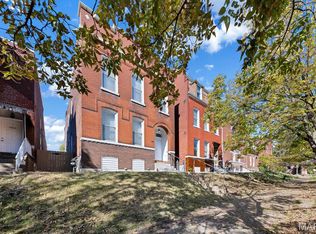
- $244,9004 bd2 ba2.8k sqft3325 Chippewa St, Saint Louis, MO 63118For Sale
 MLS ID #26048455, Matt J Guignon, Invest St. Louis. MARIS
- $270,0004 bd2 ba2.3k sqft3929 Pennsylvania Ave, Saint Louis, MO 63118For Sale
 MLS ID #26068225, Rodney Wallner, Berkshire Hathaway HomeServices Select Properties. MARIS
- $230,0004 bd2 ba1.7k sqft3540 Michigan Ave, Saint Louis, MO 63118For SaleMLS ID #26062326, Matt G Millslagle, Salient Realty Group, LLC. MARIS
- $200,0004 bd2 ba1.7k sqft3524 Minnesota Ave, Saint Louis, MO 63118For SaleMLS ID #26067601, Peter Lu, EXP Realty, LLC. MARIS
- $189,0004 bd2 ba2.1k sqft3543 Tennessee Ave, Saint Louis, MO 63118For SaleMLS ID #26053678, Gary Le'Roi Newton, Properties by G. Le' Roi LLC. MARIS
- $184,9904 bd2 ba1.9k sqft3422 S Compton Ave, Saint Louis, MO 63118For SaleMLS ID #26062567, Michael T Hill, Berkshire Hathaway HomeServices Select Properties. MARIS
- $158,5504 bd2 ba2.3k sqft4114 Minnesota Ave #A & B, Saint Louis, MO 63118For SaleMLS ID #26019083, Shannon McGillycuddy, DRG - Delhougne Realty Group. MARIS
- $259,0003 bd2 ba2.8k sqft3423 Keokuk St, Saint Louis, MO 63118For SaleMLS ID #26065962, Brueggemann Tadlock, Keller Williams Realty St. Louis. MARIS
- $219,9004 bd2 ba2.2k sqft3623 Bamberger Ave, Saint Louis, MO 63116For SaleMLS ID #26052952, Dustin C Hoog, EXP Realty, LLC. MARIS
- $225,0003 bd3 ba3.1k sqft2649 Winnebago St, Saint Louis, MO 63118For SaleMLS ID #26055228, Andrea R Fortson, Berkshire Hathaway HomeServices Select Properties. MARIS
- $264,9003 bd3 ba1.9k sqft3223 Utah St, Saint Louis, MO 63118For SaleMLS ID #26038394, Wade W Weistreich, Keller Williams Chesterfield. MARIS
- $244,5003 bd3 ba1.9k sqft3325 Minnesota Ave, Saint Louis, MO 63118For SaleMLS ID #26017742, Chrisy Smith, Realty Executives of St. Louis. MARIS
- $220,0005 bd4 ba2.7k sqft3829 Minnesota Ave, Saint Louis, MO 63118For SaleMLS ID #26064610, Logan M Ely, Compass Realty Group. MARIS
- $259,9003 bd2 ba1.8k sqft3954 Potomac St, Saint Louis, MO 63116For SaleMLS ID #26067603, Christina M Patton, EXP Realty, LLC. MARIS
- $220,0003 bd2 ba1.6k sqft3149 Michigan Ave, Saint Louis, MO 63118For SaleMLS ID #26067940, Jim P Broderick, RedKey Realty Leaders Circa. MARIS
- $215,0003 bd2 ba1.6k sqft3147 Michigan Ave, Saint Louis, MO 63118For SaleMLS ID #26066845, Jim P Broderick, RedKey Realty Leaders Circa. MARIS
- $189,9005 bd2 ba2k sqft3829 S Compton Ave, Saint Louis, MO 63118For SaleMLS ID #26059053, Anthony J Schreiber, EXP Realty, LLC. MARIS
- $325,0004 bd2 ba2.4k sqft3463 S Grand Blvd, Saint Louis, MO 63118For SaleMLS ID #26015354, Lisa Alexander, Berkshire Hathaway HomeServices Select Properties. MARIS
