Located on a quiet street in the heart of San Angelos' desirable Southland addition is this beautiful home is ready for You. This 1,778 square-foot home features recent updates, a split three bedroom floor plan, two baths, and a double car attached garage with alley parking. The home opens up into a living room with a wood burning fireplace, and a cozy eat-in kitchen and dining area. Additionally, the spacious front room can be used as a formal living or dining room. New roof 5 months ago.
For sale by owner
Street View
Price cut: $14.5K (10/25)
$255,000
3825 Tridens Trl, San Angelo, TX 76904
3beds
1,778sqft
SingleFamily
Built in 1978
10,410 Square Feet Lot
$268,400 Zestimate®
$143/sqft
$-- HOA
What's special
Two bathsQuiet street
What the owner loves about this home
Nice quite neighborhood, great neighbors. Cozy small home. One mile from Sunset Mall and one mile from Sam's Club.
- 126 days
- 329
- 6
Listed by:
Property Owner (325) 617-6340
Facts & features
Interior
Bedrooms & bathrooms
- Bedrooms: 3
- Bathrooms: 2
- Full bathrooms: 2
Heating
- Heat pump, Gas
Cooling
- Central
Appliances
- Included: Dishwasher, Garbage disposal, Microwave, Refrigerator
Features
- Flooring: Slate
- Has fireplace: Yes
Interior area
- Total interior livable area: 1,778 sqft
Property
Parking
- Parking features: Garage - Attached
Features
- Exterior features: Shingle, Brick
Lot
- Size: 10,410 Square Feet
Details
- Parcel number: 1833400002000100
Construction
Type & style
- Home type: SingleFamily
Materials
- Roof: Other
Condition
- New construction: No
- Year built: 1978
Community & HOA
Location
- Region: San Angelo
Financial & listing details
- Price per square foot: $143/sqft
- Tax assessed value: $254,050
- Annual tax amount: $3,793
- Date on market: 6/22/2026
Estimated market value
$268,400
$255,000 - $282,000
$1,966/mo
Price history
| Date | Event | Price |
|---|---|---|
| 10/25/2026 | Price change | $255,000-5.4%$143/sqft |
Source: Owner Report a problem | ||
| 9/1/2026 | Price change | $269,500-3.4%$152/sqft |
Source: Owner Report a problem | ||
| 8/21/2026 | Price change | $279,000+7.5%$157/sqft |
Source: Owner Report a problem | ||
| 6/30/2026 | Price change | $259,500-3.7%$146/sqft |
Source: Owner Report a problem | ||
| 6/22/2026 | Listed for sale | $269,500+22.5%$152/sqft |
Source: Owner Report a problem | ||
| 6/23/2021 | Sold | -- |
Source:  San Angelo AOR #104562 Report a problem | ||
| 5/18/2021 | Pending sale | $220,000$124/sqft |
Source:  NextHome #104562 Report a problem | ||
| 5/18/2021 | Listed for sale | $220,000$124/sqft |
Source: NextHome #104562 Report a problem | ||
Public tax history
| Year | Property taxes | Tax assessment |
|---|---|---|
| 2025 | $3,793 -1.5% | $254,050 -2.3% |
| 2024 | $3,851 -26.8% | $259,910 -1.7% |
| 2023 | $5,258 -2.1% | $264,290 +9.1% |
| 2022 | $5,368 +58.1% | $242,280 +31.9% |
| 2021 | $3,396 | $183,720 +18.9% |
| 2020 | -- | $154,550 |
| 2019 | $3,105 -3.6% | $154,550 -0.9% |
| 2018 | $3,221 +2.5% | $155,970 +1.9% |
| 2017 | $3,141 +133.2% | $153,120 |
| 2016 | $1,347 +3.7% | $153,120 +54.6% |
| 2015 | $1,300 -13% | $99,050 -14.5% |
| 2014 | $1,495 +3% | $115,820 +13% |
| 2013 | $1,452 | $102,500 |
| 2012 | $1,452 +2% | $102,500 +7% |
| 2011 | $1,423 | $95,800 |
| 2010 | $1,423 | $95,800 +7.3% |
| 2009 | -- | $89,300 |
| 2008 | -- | $89,300 |
| 2007 | $1,360 -16.2% | $89,300 -1.8% |
| 2006 | $1,623 | $90,950 |
| 2005 | $1,623 +18.5% | $90,950 |
| 2004 | $1,369 | $90,950 |
| 2003 | $1,369 +16.4% | $90,950 +9.9% |
| 2002 | $1,176 +1.5% | $82,750 |
| 2001 | $1,159 +2.2% | $82,750 +12.8% |
| 2000 | $1,134 | $73,350 |
Find assessor info on the county website
Monthly payment
Est. payment
Payment breakdown
Explore the cost of this home by adjusting the details. Changes won't be saved.Climate risks
Neighborhood: Bonham
- $288,700-- bd-- ba2.1k sqft3821 Tridens Trl, San Angelo, TX 76904Off Market
- $288,200-- bd-- ba2k sqft3826 Southland Blvd, San Angelo, TX 76904Off Market
- $275,9003 bd2 ba1.9k sqft3817 Tridens Trl, San Angelo, TX 76904Off Market
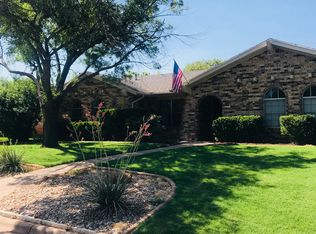
- $285,000-- bd-- ba2k sqft3822 Southland Blvd, San Angelo, TX 76904Off Market
Similar homes
- $239,5003 bd2 ba1.5k sqft4113 Shefflera Dr, San Angelo, TX 76904For Sale
 MLS ID #202740, Case Hardin, Bob Ingram Real Estate. San Angelo AOR
- $235,0003 bd2 ba1.7k sqft3714 Honeysuckle Ln, San Angelo, TX 76904For Sale
 MLS ID #202821, Home and Land Group, ERA Newlin & Company. San Angelo AOR
- $245,0003 bd2 ba1.4k sqft4418 Southland Blvd, San Angelo, TX 76904For Sale
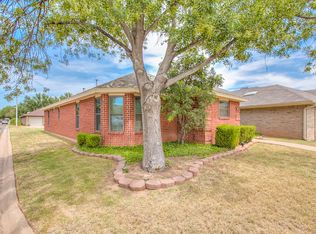 MLS ID #202081, Expect the Max Team, Coldwell Banker Legacy. San Angelo AOR
- $299,9003 bd2 ba1.8k sqft4817 Bermuda Dr, San Angelo, TX 76904For Sale
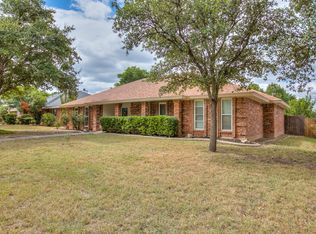 MLS ID #202638, Team McAda, ERA Newlin & Company. San Angelo AOR
