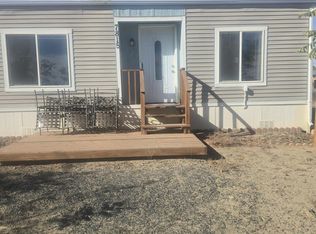
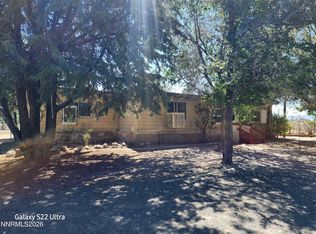
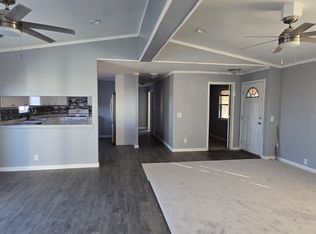
$332,700
2 bd2 ba1.1k sqft
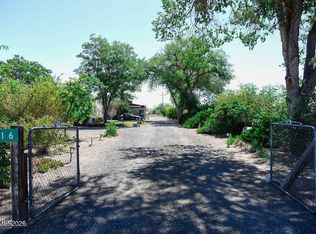
3908 Cypress St, Silver Springs, NV 89429
Off Market
Likely to sell faster than
Zillow last checked:
Listing updated:
Katherine Gillespie BS.146653 775-636-0964,
eXp Realty

$303,700
$289,000 - $319,000
Not available
| Date | Event | Price |
|---|---|---|
| 10/20/2026 | Listed for sale | $309,900-8.9%$269/sqft |
Source:  NNRMLS #260013352 Report a problem | ||
| 4/7/2026 | Listing removed | -- |
Source: Owner Report a problem | ||
| 3/17/2026 | Listed for sale | $340,000$295/sqft |
Source: Owner Report a problem | ||
| 1/23/2026 | Listing removed | -- |
Source: Owner Report a problem | ||
| 12/31/2025 | Listed for sale | $340,000$295/sqft |
Source: Owner Report a problem | ||
| 12/20/2025 | Listing removed | -- |
Source: Owner Report a problem | ||
| 11/7/2025 | Listed for sale | $340,000+51.2%$295/sqft |
Source: Owner Report a problem | ||
| 2/28/2022 | Sold | $224,900$195/sqft |
Source: Public Record Report a problem | ||
| 12/7/2021 | Pending sale | $224,900$195/sqft |
Source: NNRMLS #210017444 Report a problem | ||
| 11/29/2021 | Listed for sale | $224,900+649.7%$195/sqft |
Source: NNRMLS #210017444 Report a problem | ||
| 10/9/2014 | Listing removed | $675$1/sqft |
Source: REMAX Authority Report a problem | ||
| 9/10/2014 | Price change | $675-3.6%$1/sqft |
Source: REMAX Authority Report a problem | ||
| 8/27/2014 | Price change | $700-6.7%$1/sqft |
Source: REMAX Authority Report a problem | ||
| 5/29/2014 | Listed for rent | $750$1/sqft |
Source: REMAX Authority Report a problem | ||
| 5/16/2014 | Sold | $30,000$26/sqft |
Source: Public Record Report a problem | ||
| Year | Property taxes | Tax assessment |
|---|---|---|
| 2025 | $1,245 +2.5% | $34,941 -1.7% |
| 2024 | $1,214 +29.9% | $35,559 +14.9% |
| 2023 | $935 +93.1% | $30,939 +43.1% |
| 2022 | $484 | $21,617 +15.1% |
| 2021 | -- | $18,783 -0.1% |
| 2020 | $457 | $18,804 +20.9% |
| 2019 | $457 +4.7% | $15,559 +40.8% |
| 2018 | $436 -29.7% | $11,054 -0.1% |
| 2017 | $620 +1.9% | $11,060 +26.7% |
| 2016 | $609 +1.3% | $8,732 +1.8% |
| 2015 | $601 +0.8% | $8,579 +3.8% |
| 2014 | $596 | $8,263 -25.6% |
| 2013 | -- | $11,101 |
| 2012 | -- | $11,101 -8.9% |
| 2011 | -- | $12,185 -0.9% |
| 2010 | -- | $12,295 -28.5% |
| 2009 | -- | $17,204 -17.8% |
| 2008 | -- | $20,917 +42.7% |
| 2007 | -- | $14,655 +47.6% |
| 2006 | -- | $9,926 +66.5% |
| 2004 | -- | $5,960 |
Source: NNRMLS. This data may not be complete. We recommend contacting the local school district to confirm school assignments for this home.
A local agent can set up tours, give advice and negotiate with sellers.