Nice two family with separate utilities - each unit has tandem paved driveway - convenient area near parks, school, town and hospital. This home is a great investment opportunity plus excellent owner occupied potential. First floor is a one bedroom spacious unit - Second floor has 2 floors with 4 bedrooms -
For sale
$599,900
40 West St, Milford, MA 01757
5beds
2,127sqft
2 Family - 2 Units Up/Down
Built in 1900
-- sqft lot
$590,100 Zestimate®
$282/sqft
$-- HOA
What's special
Tandem paved drivewayOne bedroom spacious unit
- 18 days
- 520
- 23
Zillow last checked:
Listing updated:
Listed by:
Sheila Wajda 508-478-6232,
Afonso Real Estate 508-478-7286
Source: MLS PIN,MLS#: 73586004
Facts & features
Interior
Bedrooms & bathrooms
- Bedrooms: 5
- Bathrooms: 2
- Full bathrooms: 2
Heating
- Steam, Natural Gas, Electric
Cooling
- None
Appliances
- Included: Range, Refrigerator
Features
- Bathroom With Tub & Shower, Walk-Up Attic, Heated Attic, Living Room, Dining Room, Kitchen
- Flooring: Wood, Carpet
- Basement: Full,Unfinished
- Has fireplace: No
Interior area
- Total structure area: 2,127
- Total interior livable area: 2,127 sqft
- Finished area above ground: 2,127
- Finished area below ground: 0
Property
Parking
- Total spaces: 6
- Parking features: Paved Drive, Paved
- Uncovered spaces: 6
Lot
- Size: 5,000 Square Feet
Details
- Parcel number: 1618425
- Zoning: RA
Construction
Type & style
- Home type: MultiFamily
- Property subtype: 2 Family - 2 Units Up/Down
Materials
- Frame
- Foundation: Stone, Brick/Mortar
- Roof: Shingle
Condition
- Year built: 1900
Utilities & green energy
- Electric: Individually Metered
- Sewer: Public Sewer
- Water: Public
- Utilities for property: for Electric Range
Community & HOA
Community
- Features: Public Transportation, Shopping, Pool, Tennis Court(s), Park, Walk/Jog Trails, Golf, Medical Facility, Laundromat, Bike Path, Highway Access, Public School
Location
- Region: Milford
Financial & listing details
- Price per square foot: $282/sqft
- Tax assessed value: $475,100
- Annual tax amount: $6,425
- Date on market: 10/2/2026
- Listing terms: Contract
- Exclusions: Tenants Personal Belongings
- Total actual rent: 3300
Estimated market value
$590,100
$561,000 - $620,000
$2,724/mo
Price history
| Date | Event | Price |
|---|---|---|
| 10/2/2026 | Listed for sale | $599,900+210.8%$282/sqft |
Source: MLS PIN #73586004 Report a problem | ||
| 11/21/2013 | Sold | $193,000-8.1%$91/sqft |
Source: Public Record Report a problem | ||
| 8/27/2013 | Price change | $209,900-4.5%$99/sqft |
Source: Herrera Real Estate #71567829 Report a problem | ||
| 8/10/2013 | Listed for sale | $219,900+51.7%$103/sqft |
Source: Herrera Real Estate #71567829 Report a problem | ||
| 11/18/2011 | Sold | $145,000+3.6%$68/sqft |
Source: Public Record Report a problem | ||
| 8/25/2011 | Price change | $140,000-6.7%$66/sqft |
Source: Property Services Network #71239920 Report a problem | ||
| 7/30/2011 | Price change | $150,000-6.3%$71/sqft |
Source: Property Services Network #71239920 Report a problem | ||
| 6/25/2011 | Price change | $160,000-8.6%$75/sqft |
Source: Property Services Network #71239920 Report a problem | ||
| 5/26/2011 | Listed for sale | $175,000+960.6%$82/sqft |
Source: Property Services Network Inc. Report a problem | ||
| 12/15/1999 | Sold | $16,500$8/sqft |
Source: Public Record Report a problem | ||
| 3/3/1998 | Sold | $16,500$8/sqft |
Source: Public Record Report a problem | ||
Public tax history
| Year | Property taxes | Tax assessment |
|---|---|---|
| 2025 | $6,081 +2.7% | $475,100 +6.6% |
| 2024 | $5,922 +18.4% | $445,600 +28.7% |
| 2023 | $5,001 +2.5% | $346,100 +9.2% |
| 2022 | $4,879 +6.3% | $317,000 +10.4% |
| 2021 | $4,588 +2.3% | $287,100 +2.2% |
| 2020 | $4,485 +9.7% | $281,000 +13.6% |
| 2019 | $4,090 +10.2% | $247,300 +10.3% |
| 2018 | $3,713 +3.1% | $224,200 +4.5% |
| 2017 | $3,601 +2.9% | $214,500 +5.3% |
| 2016 | $3,501 -4.9% | $203,800 -2.8% |
| 2015 | $3,680 +10.4% | $209,700 +11.3% |
| 2014 | $3,333 +2.5% | $188,400 -1.8% |
| 2013 | $3,253 +3.1% | $191,900 -1.7% |
| 2012 | $3,156 -0.9% | $195,200 -6.7% |
| 2011 | $3,186 +2.1% | $209,300 -5.5% |
| 2010 | $3,119 -10.8% | $221,500 -20.6% |
| 2009 | $3,497 +0.3% | $279,100 -5.5% |
| 2008 | $3,487 +4.8% | $295,500 -3.2% |
| 2007 | $3,327 +7.6% | $305,200 +12% |
| 2006 | $3,093 +5.9% | $272,500 +10.4% |
| 2005 | $2,921 +0.3% | $246,900 +1.3% |
| 2004 | $2,911 +53.7% | $243,800 +71.9% |
| 2003 | $1,894 +3% | $141,800 +10.1% |
| 2002 | $1,839 +25% | $128,800 +42.6% |
| 1998 | $1,471 | $90,300 |
Find assessor info on the county website
Monthly payment
Est. payment
Payment breakdown
Explore the cost of this home by adjusting the details. Changes won't be saved.Climate risks
Neighborhood: 01757
Similar homes
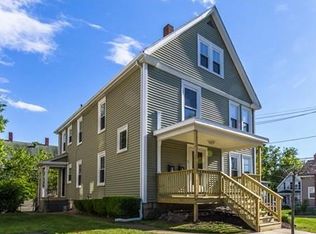
- $625,0008 bd2 ba2.5k sqft13-15 Maple St, Northbridge, MA 01534For Sale
 MLS ID #73586624, Christine L. Najem, eXp Realty LLC. MLS PIN
- $569,0004 bd2 ba1.5k sqft132 Prospect St, Marlborough, MA 01752For Sale
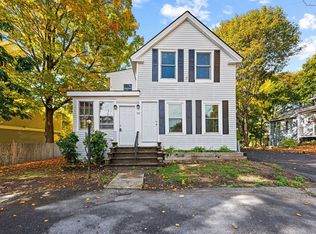 MLS ID #73591275, Kapil Batra, Berkshire Hathaway HomeServices Commonwealth Real Estate. MLS PIN
- $649,9004 bd2 ba1.5k sqft16 Warfield St, Hopedale, MA 01747For Sale
 MLS ID #73553785, Mark Rizoli, Lamacchia Realty, Inc.. MLS PIN
- $525,0004 bd3 ba1.8k sqft123 W Main St, Marlborough, MA 01752For Sale
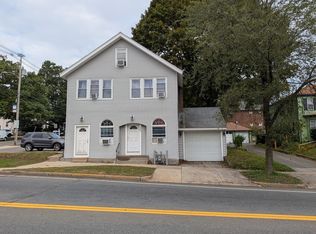 MLS ID #73585440, Stefanie Ferrecchia, Dora Naves & Associates. MLS PIN
- $629,9007 bd3 ba2.4k sqft77 Henry St, Central Falls, RI 02863For Sale
 MLS ID #1426099, Robin Chudnow-Marsh, Coldwell Banker Realty. StateWide MLS RI
