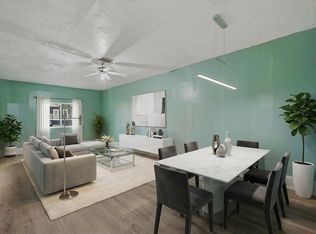
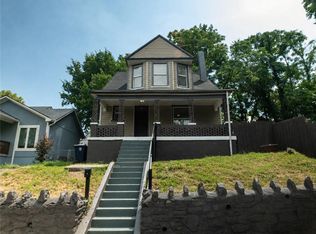
All updated with fresh paint and New carpet throughout! Gorgeous fireplace is the focal point of the large living area. Nice size formal dining room and updated kitchen. 3 bedrooms and large full bath. New HVAC. All utilities are separated per unit includidng water. Great neighborhood. Similar Duplex 2 doors East sold for $320k recently. Charming front porch and red brick exterior make for inviting curb appeal. This is a great investment or owner occupied home! Hurry this one won't last at this price.
One unit occupied bottom unit vacant an easy to show. Seller is selling in present condition. Thanks for showing! Please be respectful of occupied unit (Right Side Door) which is not to be shown unless an offer is being presented.
Show for backups
Price cut: $45.5K (9/15)
$199,500
4001 Morrell Ave, Kansas City, MO 64123
--beds
1baths
--sqft
Duplex
Built in 1920
-- sqft lot
$-- Zestimate®
$--/sqft
$-- HOA
What's special
Red brick exteriorCharming front porchFresh paintNew carpet throughoutUpdated kitchenInviting curb appealNew hvac
- 53 days
- 29
- 3
Zillow last checked:
Listing updated:
Listed by:
Julie McLarney 816-304-6545,
Compass Realty Group
Source: Heartland MLS as distributed by MLS GRID,MLS#: 2640319
Facts & features
Interior
Bedrooms & bathrooms
- Bathrooms: 1
Heating
- Electric
Cooling
- Electric
Appliances
- Included: Cooktop, Dishwasher, Disposal, Dryer, Free-Standing Electric Oven, Washer, Ind Water Heaters
Features
- Has basement: Yes
Property
Parking
- Total spaces: 2
- Parking features: Off Street
Features
- Patio & porch: Porch
Lot
- Size: 0.69 Acres
- Dimensions: 30 x 104
Details
- Parcel number: 13940087700000000
- Zoning: R-2
Construction
Type & style
- Home type: MultiFamily
- Property subtype: Duplex
Materials
- Brick Trim, Vinyl Siding
- Roof: Composition
Condition
- Year built: 1920
Utilities & green energy
- Sewer: Public Sewer
- Water: Public
Community & HOA
Community
- Subdivision: Rhodes & Craigs
HOA
- Has HOA: No
Location
- Region: Kansas City
Financial & listing details
- Tax assessed value: $78,020
- Annual tax amount: $1,243
- Date on market: 9/13/2026
- Listing terms: Cash,Conventional,FHA,VA Loan
Estimated market value
Not available
Estimated sales range
Not available
Not available
Price history
| Date | Event | Price |
|---|---|---|
| 9/28/2026 | Contingent | $199,500 |
Source:  Heartland MLS as distributed by MLS GRID #2640319 Report a problem | ||
| 9/15/2026 | Price change | $199,500-18.6% |
Source: Heartland MLS as distributed by MLS GRID #2640319 Report a problem | ||
| 9/13/2026 | Listed for sale | $245,000-2% |
Source: Heartland MLS as distributed by MLS GRID #2640319 Report a problem | ||
| 8/25/2026 | Listing removed | $1,125 |
Source: Zillow Rentals Report a problem | ||
| 8/20/2026 | Listed for rent | $1,125+7.1% |
Source: Zillow Rentals Report a problem | ||
| 11/27/2024 | Listing removed | $1,050 |
Source: Zillow Rentals Report a problem | ||
| 11/20/2024 | Listed for rent | $1,050+5.5% |
Source: Zillow Rentals Report a problem | ||
| 2/12/2024 | Listing removed | -- |
Source: Zillow Rentals Report a problem | ||
| 1/31/2024 | Price change | $995-2.9% |
Source: Zillow Rentals Report a problem | ||
| 1/18/2024 | Price change | $1,025-2.4% |
Source: Zillow Rentals Report a problem | ||
| 1/8/2024 | Price change | $1,050-4.5% |
Source: Zillow Rentals Report a problem | ||
| 1/5/2024 | Listing removed | $250,000 |
Source:  ReeceNichols Real Estate #2465117 Report a problem | ||
| 12/12/2023 | Listed for rent | $1,100 |
Source: Zillow Rentals Report a problem | ||
| 12/1/2023 | Listed for sale | $250,000 |
Source: Heartland MLS as distributed by MLS GRID #2465117 Report a problem | ||
| 11/23/2023 | Listing removed | -- |
Source: Zillow Rentals Report a problem | ||
| 11/13/2023 | Listing removed | $250,000 |
Source: ReeceNichols Real Estate #2458655 Report a problem | ||
| 11/8/2023 | Listed for rent | $1,100 |
Source: Zillow Rentals Report a problem | ||
| 10/18/2023 | Price change | $250,000-7.1% |
Source: Heartland MLS as distributed by MLS GRID #2458655 Report a problem | ||
| 10/11/2023 | Listed for sale | $269,000 |
Source: Heartland MLS as distributed by MLS GRID #2458655 Report a problem | ||
| 10/24/2013 | Sold | -- |
Source: Heartland MLS as distributed by MLS GRID #1823233 Report a problem | ||
Public tax history
| Year | Property taxes | Tax assessment |
|---|---|---|
| 2025 | $1,243 -10.3% | $14,824 -15.6% |
| 2024 | $1,386 +1% | $17,566 |
| 2023 | $1,373 +48.9% | $17,566 +56.7% |
| 2022 | $922 +0.3% | $11,211 |
| 2021 | $919 +3% | $11,211 +4.3% |
| 2020 | $893 +2.1% | $10,752 |
| 2019 | $874 | $10,752 +74% |
| 2018 | $874 +70.5% | $6,179 |
| 2017 | $513 +19.4% | $6,179 +15% |
| 2016 | $429 -0.6% | $5,374 |
| 2014 | $432 -0.6% | $5,374 |
| 2013 | $435 +0.5% | $5,374 |
| 2012 | $433 +0.1% | $5,374 |
| 2011 | $432 +0.9% | $5,374 |
| 2010 | $428 -25.6% | $5,374 |
| 2009 | $576 +0.5% | $5,374 -26% |
| 2008 | $573 +13.9% | $7,262 |
| 2007 | $503 +0% | $7,262 +15% |
| 2006 | $503 +16.7% | $6,314 |
| 2005 | $431 +0.1% | $6,314 +15% |
| 2004 | $431 +9.3% | $5,491 |
| 2003 | $394 +0.3% | $5,491 +10% |
| 2002 | $393 -0.2% | $4,991 |
| 2001 | $394 | $4,991 |
Find assessor info on the county website
Monthly payment
Est. payment
Payment breakdown
Explore the cost of this home by adjusting the details. Changes won't be saved.Climate risks
Neighborhood: Sarritt Point


Similar homes
- $195,0003 bd1 ba1.2k sqft3525 Windsor Ave, Kansas City, MO 64123For Sale
 MLS ID #2640161, VIVE in KC Team, EXP Realty LLC. Heartland MLS as distributed by MLS GRID
- $200,0003 bd2 ba1.5k sqft3510 Thompson Ave, Kansas City, MO 64124For Sale
 MLS ID #2619841, Stephanie Velasco, Keller Williams Realty Partners Inc.. Heartland MLS as distributed by MLS GRID
- $199,0003 bd2 ba1.6k sqft2011 Montgall Ave, Kansas City, MO 64127For Sale
 MLS ID #2642462, Daniel Israel, TribeKC Realty. Heartland MLS as distributed by MLS GRID
- $220,0004 bd2 ba1.4k sqft433 N Oakley Ave, Kansas City, MO 64123For Sale
 MLS ID #2645157, Ngon Nguyen, Northeast Realty Company. Heartland MLS as distributed by MLS GRID
