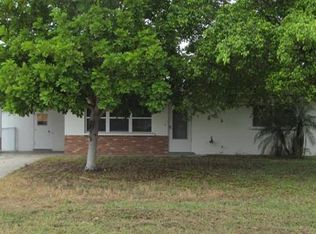
This 1655 square foot single family home has 3 bedrooms and 2.0 bathrooms. This home is located at 4004 52nd St W, Bradenton, FL 34209.
Pre-foreclosure
Est. $349,700
4004 52nd St W, Bradenton, FL 34209
3beds
1,655sqft
SingleFamily
Built in 1971
7,501 Square Feet Lot
$349,700 Zestimate®
$211/sqft
$-- HOA
Overview
- 24 days
- 13
- 0
Facts & features
Interior
Bedrooms & bathrooms
- Bedrooms: 3
- Bathrooms: 2
- Full bathrooms: 2
Heating
- Other, Electric
Cooling
- Central
Appliances
- Included: Dishwasher, Dryer, Microwave, Range / Oven, Refrigerator, Washer
Features
- Flooring: Tile, Carpet
- Has fireplace: Yes
- Furnished: Yes
Interior area
- Total interior livable area: 1,655 sqft
Property
Parking
- Total spaces: 1
- Parking features: Carport, Garage - Attached
Features
- Exterior features: Stone, Cement / Concrete
Lot
- Size: 7,501 Square Feet
Details
- Parcel number: 5119300001
Construction
Type & style
- Home type: SingleFamily
Materials
- masonry
- Roof: Composition
Condition
- Year built: 1971
Community & HOA
Location
- Region: Bradenton
Financial & listing details
- Price per square foot: $211/sqft
- Tax assessed value: $287,244
- Annual tax amount: $2,349
Foreclosure details
Estimated market value
$349,700
$318,000 - $381,000
$2,747/mo
Price history
| Date | Event | Price |
|---|---|---|
| 4/11/2016 | Sold | $188,000+0.1%$114/sqft |
Source: Stellar MLS #A4142583 Report a problem | ||
| 2/2/2016 | Price change | $187,777-5.1%$113/sqft |
Source: ROSEBAY INTERNATIONAL INC #A4142583 Report a problem | ||
| 1/14/2016 | Listed for sale | $197,777+190.8%$120/sqft |
Source: ROSEBAY INTERNATIONAL INC #A4142583 Report a problem | ||
| 4/24/2009 | Sold | $68,000-14.9%$41/sqft |
Source: Public Record Report a problem | ||
| 2/14/2009 | Price change | $79,900-24.6%$48/sqft |
Source: NRT Florida #A3898211 Report a problem | ||
| 11/22/2008 | Listed for sale | $105,900-54%$64/sqft |
Source: NRT Florida #A3898211 Report a problem | ||
| 1/9/2007 | Sold | $230,000+33.7%$139/sqft |
Source: Public Record Report a problem | ||
| 5/10/2005 | Sold | $172,000+100.9%$104/sqft |
Source: Public Record Report a problem | ||
| 7/7/2004 | Sold | $85,600+9.7%$52/sqft |
Source: Public Record Report a problem | ||
| 2/2/1994 | Sold | $78,000$47/sqft |
Source: Public Record Report a problem | ||
Public tax history
| Year | Property taxes | Tax assessment |
|---|---|---|
| 2025 | $2,349 +3.6% | $180,430 +2.9% |
| 2024 | $2,268 +1.2% | $175,345 +3% |
| 2023 | $2,242 +3.4% | $170,238 +3% |
| 2022 | $2,168 +0.9% | $165,280 +3% |
| 2021 | $2,148 +1.5% | $160,466 +1.4% |
| 2020 | $2,116 +2.1% | $158,250 +2.3% |
| 2019 | $2,072 | $154,692 +1.9% |
| 2018 | $2,072 +1.5% | $151,808 +2.1% |
| 2017 | $2,041 +23% | $148,686 +41.5% |
| 2016 | $1,660 | $105,055 +13% |
| 2015 | $1,660 | $92,992 +2.4% |
| 2014 | $1,660 +6% | $90,847 +6% |
| 2013 | $1,566 +156529% | $85,743 +4.2% |
| 2012 | $1 | $82,322 +9.6% |
| 2011 | $1 | $75,138 -12.3% |
| 2010 | -- | $85,629 -29.6% |
| 2009 | $2,145 -13.4% | $121,616 -21.1% |
| 2008 | $2,476 -17.6% | $154,168 -16.2% |
| 2007 | $3,006 -0.3% | $183,927 +7.2% |
| 2006 | $3,016 +11.8% | $171,511 +15.2% |
| 2005 | $2,698 +146.7% | $148,871 +76.1% |
| 2004 | $1,094 +1% | $84,526 +1.9% |
| 2003 | $1,083 +8.8% | $82,950 +2.4% |
| 2002 | $995 +3.8% | $81,006 +1.6% |
| 2001 | $959 +2.3% | $79,730 +3% |
| 2000 | $937 | $77,408 |
Find assessor info on the county website
Monthly payment
Climate risks
Neighborhood: 34209

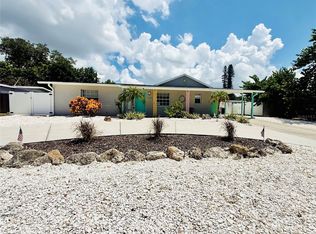
Similar homes
- $399,9003 bd2 ba1.4k sqft3410 50TH STREET W, BRADENTON, FL 34209For Sale

 MLS ID #TB8538269, Robert Rochlin, SUN COVE REALTY INC. Stellar MLS
- $349,9003 bd2 ba1.4k sqft6607 36TH AVENUE DRIVE W, BRADENTON, FL 34209For Sale
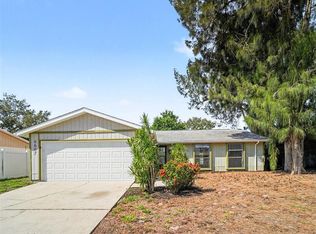 MLS ID #O6441016, Robert Salmons, ENTERA REALTY LLC. Stellar MLS
- $415,0003 bd2 ba1.5k sqft3508 65TH STREET W, BRADENTON, FL 34209For Sale
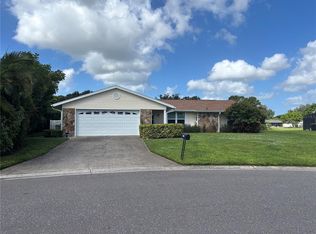 MLS ID #A4710198, Jessie Hayre, BRIGHT REALTY. Stellar MLS
- $375,0003 bd3 ba1.8k sqft4505 33RD AVENUE W, BRADENTON, FL 34209For Sale
 MLS ID #A4702028, Tiffany Hamilton, PA, COLDWELL BANKER REALTY. Stellar MLS
- $335,0002 bd2 ba1.2k sqft3403 68TH STREET W, BRADENTON, FL 34209For SaleMLS ID #A4703908, Kerre Allman, MARCUS & COMPANY REALTY. Stellar MLS
- $375,9002 bd2 ba1.2k sqft5008 27TH AVENUE W, BRADENTON, FL 34209For SaleMLS ID #A4690317, Nicole Sampson, RE/MAX ALLIANCE GROUP. Stellar MLS
- $415,0003 bd2 ba1.7k sqft4919 32ND AVENUE DRIVE W, BRADENTON, FL 34209For SaleMLS ID #A4700932, Andy Cochran, JASON MITCHELL REAL ESTATE FLO. Stellar MLS
- $295,0002 bd1 ba1.2k sqft5320 41ST AVENUE W, BRADENTON, FL 34209For SaleMLS ID #A4696224, Jessie Bonner, SARABAY REAL ESTATE INC. Stellar MLS
- $179,0002 bd2 ba1k sqft3620 IRONWOOD CIRCLE #404O, BRADENTON, FL 34209For SaleMLS ID #A4710467, Stephanie Yoder, REAL BROKER, LLC. Stellar MLS
- $260,0002 bd2 ba1k sqft4040 IRONWOOD CIRCLE #702F, BRADENTON, FL 34209For SaleMLS ID #A4708314, Stephen Arters, FINE PROPERTIES. Stellar MLS
- $429,9992 bd2 ba1.4k sqft3505 45TH STREET W, BRADENTON, FL 34209For SaleMLS ID #A4702933, Brooke Mailloux, THE KEYES COMPANY - SARASOTA. Stellar MLS
- $265,0002 bd2 ba1.2k sqft4530 PINEBROOK CIRCLE #208, BRADENTON, FL 34209For SaleMLS ID #TB8559185, ADRIANA ORTEGA DE QUAGLIATO, FINE PROPERTIES. Stellar MLS
- $475,0003 bd2 ba1.5k sqft4502 33RD AVENUE W, BRADENTON, FL 34209For SaleMLS ID #A4706973, Don Lewis, RE/MAX ALLIANCE GROUP. Stellar MLS
- $279,0001 bd2 ba1.1k sqft4460 FAIRWAYS BOULEVARD #105, BRADENTON, FL 34209For SaleMLS ID #TB8560643, Janice Sanburn, EXP REALTY LLC. Stellar MLS
- $330,0003 bd2 ba1.6k sqft509 LAKESIDE DRIVE #509, BRADENTON, FL 34210For SaleMLS ID #A4708000, Brandi Furlan, KW COASTAL LIVING III. Stellar MLS
- $220,0002 bd2 ba1.1k sqft3950 IRONWOOD CIRCLE #205, BRADENTON, FL 34209For SaleMLS ID #A4709672, Trevor Schmidt, KW SUNCOAST. Stellar MLS
- $260,0002 bd2 ba1.3k sqft4570 PINEBROOK CIRCLE #208, BRADENTON, FL 34209For SaleMLS ID #A4706920, Jordan Chancey, PA, MATTHEW GUTHRIE AND ASSOCIATES REALTY LLC. Stellar MLS
- $450,0003 bd2 ba1.6k sqft4115 23RD AVE W, BRADENTON, FL 34205For SaleMLS ID #A4707587, Phoebe Zhang, FLORIDA MORNING REALTY LLC. Stellar MLS
- $275,0002 bd2 ba1.3k sqft4460 FAIRWAYS BOULEVARD #401, BRADENTON, FL 34209For SaleMLS ID #TB8560805, Kim Kelly, KAREN PFEIFFER & ASSOCIATES. Stellar MLS
- $389,9003 bd2 ba1.2k sqft3905 SANDPOINTE DRIVE, BRADENTON, FL 34205For SaleMLS ID #A4706102, Benjamin Bruce, LEGACY REAL ESTATE ASSOCIATES, LLC. Stellar MLS
