This 1827 square foot single family home has 3 bedrooms and 2.0 bathrooms. This home is located at 4055 Carson Dr SE, Salem, OR 97317.
Pre-foreclosure
Street View
Est. $372,700
4055 Carson Dr SE, Salem, OR 97317
3beds
1,827sqft
SingleFamily
Built in 1963
8,276 Square Feet Lot
$372,700 Zestimate®
$204/sqft
$-- HOA
Overview
- 39 days
- 43
- 2
Facts & features
Interior
Bedrooms & bathrooms
- Bedrooms: 3
- Bathrooms: 2
- Full bathrooms: 1
- 1/2 bathrooms: 1
Heating
- Baseboard, Electric
Cooling
- None
Appliances
- Included: Dishwasher, Garbage disposal, Range / Oven, Refrigerator
Features
- Flooring: Hardwood
- Basement: None
- Has fireplace: Yes
Interior area
- Total interior livable area: 1,827 sqft
Property
Parking
- Parking features: Garage - Attached
Lot
- Size: 8,276 Square Feet
Details
- Parcel number: 554203
Construction
Type & style
- Home type: SingleFamily
Materials
- Roof: Shake / Shingle
Condition
- Year built: 1963
Community & HOA
Location
- Region: Salem
Financial & listing details
- Price per square foot: $204/sqft
- Tax assessed value: $356,120
- Annual tax amount: $3,521
Foreclosure details
Estimated market value
$372,700
$324,000 - $410,000
$2,968/mo
Price history
| Date | Event | Price |
|---|---|---|
| 12/3/2025 | Sold | $2,500$1/sqft |
Source: Public Record Report a problem | ||
Public tax history
| Year | Property taxes | Tax assessment |
|---|---|---|
| 2025 | $3,521 +7.8% | $171,360 +3% |
| 2024 | $3,267 +3% | $166,370 +6.1% |
| 2023 | $3,170 +2.9% | $156,830 |
| 2022 | $3,082 +2.9% | $156,830 +3% |
| 2021 | $2,994 +3% | $152,270 +6.1% |
| 2020 | $2,907 +3.6% | $143,540 |
| 2019 | $2,804 +1.3% | -- |
| 2018 | $2,768 | -- |
| 2017 | $2,768 +16.3% | -- |
| 2016 | $2,380 | -- |
| 2015 | $2,380 +6.4% | -- |
| 2014 | $2,237 +9.7% | -- |
| 2013 | $2,039 | -- |
| 2012 | $2,039 -9.4% | -- |
| 2011 | $2,250 +4.2% | $120,240 +6.1% |
| 2010 | $2,160 +1.1% | $113,340 |
| 2009 | $2,136 +6% | $113,340 +3% |
| 2008 | $2,015 +3.3% | $110,040 |
| 2007 | $1,952 +1.7% | -- |
| 2006 | $1,920 +2% | -- |
| 2005 | $1,881 -0.4% | -- |
| 2004 | $1,890 +4.9% | -- |
| 2003 | $1,802 +2.5% | -- |
| 2002 | $1,759 +3.1% | -- |
| 2001 | $1,706 +3.2% | -- |
| 2000 | $1,653 | -- |
Find assessor info on the county website
Monthly payment
Climate risks
Neighborhood: Southeast Mill Creek


Similar homes
- $375,0003 bd2 ba1k sqft927 Lanai St SE, Salem, OR 97317For Sale
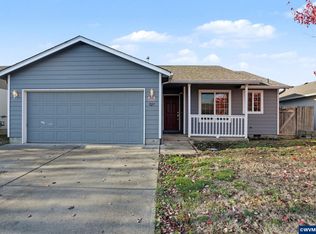
 MLS ID #847135, MELISSA IRVIN, Works Real Estate. WVMLS
- $359,0003 bd2 ba1.2k sqft4527 Garden Ct SE, Salem, OR 97317For Sale
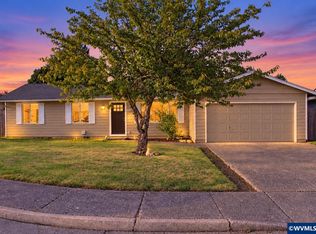 MLS ID #845768, JAIME HUDSON, Premiere Property Group, Llc Albany. WVMLS
- $405,0003 bd2 ba1.2k sqft4314 Munkers St SE, Salem, OR 97317For Sale
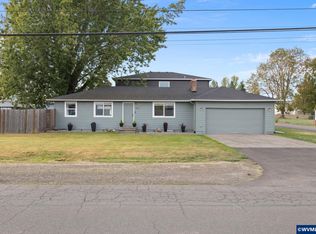 MLS ID #846195, JOEL GANDER, Gander Property Group. WVMLS
- $450,0003 bd2 ba1.3k sqft4288 Akin Ct SE, Salem, OR 97317For Sale
 MLS ID #846992, ERIC FISKUM, Re/Max Integrity - Salem. WVMLS
- $395,0003 bd2 ba1.3k sqft4659 Red Cherry Ct, Salem, OR 97317Active
 MLS ID #157929766, Molly McAnulty, Premiere Property Group, LLC. RMLS (OR)
- $395,0003 bd2 ba1.3k sqft4659 Red Cherry Ct SE, Salem, OR 97317For SaleMLS ID #846843, MOLLY MCANULTY, Premiere Property Group, Llc Albany. WVMLS
- $375,0005 bd2 ba1.8k sqft4133 Campbell Dr SE, Salem, OR 97317For SaleMLS ID #841475, BENJAMIN OROZCO, Fcre Home. WVMLS
- $345,0003 bd2 ba1k sqft349 Duch Ln SE, Salem, OR 97317For SaleMLS ID #845256, ARIELLE HERNANDEZ, Sundance Realty Llc. WVMLS
- $394,9003 bd2 ba1k sqft386 40th Pl SE, Salem, OR 97317For SaleMLS ID #840794, PEGGY BEAN, Realty One Group Willamette Valley. WVMLS
- $399,9004 bd2 ba1.3k sqft4915 Wagon Rim Ct SE, Salem, OR 97317For SaleMLS ID #846377, SHERRI GREGORY, Keller Williams Realty-Ght. WVMLS
- $360,0003 bd2 ba1.2k sqft348 Duch Ln SE, Salem, OR 97317For SaleMLS ID #845255, ARIELLE HERNANDEZ, Sundance Realty Llc. WVMLS
- $360,0003 bd2 ba1.1k sqft358 Duch Ln SE, Salem, OR 97317For SaleMLS ID #845257, ARIELLE HERNANDEZ, Sundance Realty Llc. WVMLS
- $450,0004 bd2 ba1.5k sqft4023 & 4025, Salem, OR 97317For SaleMLS ID #846974, AUSTIN NATIVIDAD, Homesmart Realty Group. WVMLS
- $355,0003 bd2 ba1.2k sqft359 Duch Ln SE, Salem, OR 97317For SaleMLS ID #845258, ARIELLE HERNANDEZ, Sundance Realty Llc. WVMLS
- $420,0003 bd2 ba1.2k sqft4656 Cherrybud Ct SE, Salem, OR 97317For SaleMLS ID #846125, DANIEL GANDEE, Real Broker. WVMLS
- $449,0003 bd3 ba1.8k sqft987 Munkers Ct SE, Salem, OR 97317For SaleMLS ID #845896, ROSS MARTINSON, Paramount Real Estate Services. WVMLS
- $424,9003 bd2 ba1.3k sqft2477 Exmoor Ct SE, Salem, OR 97317For SaleMLS ID #846709, DAVID GONZALEZ, Sundance Realty Llc. WVMLS
- $499,9993 bd2 ba1.7k sqft4092 Sylvia St SE, Salem, OR 97317For SaleMLS ID #844303, BEAU CRAIG, Real Broker. WVMLS
- $390,0003 bd2 ba1.3k sqft435 Buckboard Ct SE, Salem, OR 97317For SaleMLS ID #841326, EDEL LOPEZ, Realty Of America, Llc. WVMLS
- $350,0003 bd2 ba1.2k sqft4570 Drake Ct NE, Salem, OR 97301For SaleMLS ID #846750, SUZANNE GILDER, Keller Williams Realty Mid Willamette. WVMLS
