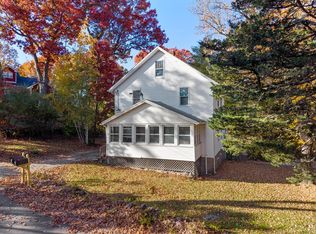
Ultra conveniently located and tucked away from the hustle and bustle, sits this beautiful home! Open floor plan, first-floor bedroom, bath, and laundry room!! Great amenities include brand-new gas and tankless heating system, oversized front and back yards, relaxing atmosphere, close to highway, downtown, chic local eateries, supermarkets, shopping at South Shore Mall, and much more!
For sale
$589,900
41 Gold St, Randolph, MA 02368
3beds
1,300sqft
Single Family Residence
Built in 1930
8,125 Square Feet Lot
$585,500 Zestimate®
$454/sqft
$-- HOA
What's special
First-floor bedroomOpen floor plan
- 10 days
- 398
- 33
Zillow last checked:
Listing updated:
Listed by:
Junior Pena 617-455-2474,
Landmark Unlimited Realty 617-303-4436
Source: MLS PIN,MLS#: 73599153
Facts & features
Interior
Bedrooms & bathrooms
- Bedrooms: 3
- Bathrooms: 2
- Full bathrooms: 1
- 1/2 bathrooms: 1
Primary bedroom
- Level: First
Bedroom 2
- Level: Second
Bedroom 3
- Level: Second
Bathroom 1
- Level: First
Bathroom 2
- Level: Second
Kitchen
- Level: First
Living room
- Level: First
Heating
- Natural Gas
Cooling
- None
Appliances
- Included: Gas Water Heater
- Laundry: First Floor
Features
- Basement: Crawl Space
- Has fireplace: No
Interior area
- Total structure area: 1,300
- Total interior livable area: 1,300 sqft
- Finished area above ground: 1,300
Property
Parking
- Total spaces: 3
- Parking features: Detached
- Garage spaces: 1
- Uncovered spaces: 2
Lot
- Size: 8,125 Square Feet
- Features: Corner Lot
Details
- Parcel number: M:0028 B:000A L:3710,209453
- Zoning: RH
Construction
Type & style
- Home type: SingleFamily
- Architectural style: Colonial
- Property subtype: Single Family Residence
Materials
- Foundation: Other
Condition
- Year built: 1930
Utilities & green energy
- Electric: Circuit Breakers
- Sewer: Public Sewer
- Water: Public
Community & HOA
Community
- Features: Walk/Jog Trails, Golf, Medical Facility, Bike Path, Conservation Area, Highway Access, House of Worship, Other
HOA
- Has HOA: No
Location
- Region: Randolph
Financial & listing details
- Price per square foot: $454/sqft
- Tax assessed value: $473,000
- Annual tax amount: $5,477
- Date on market: 11/5/2026
Estimated market value
$585,500
$556,000 - $615,000
$3,458/mo
Price history
| Date | Event | Price |
|---|---|---|
| 11/5/2026 | Listed for sale | $589,900+73.5%$454/sqft |
Source: MLS PIN #73599153 Report a problem | ||
| 5/3/2022 | Sold | $340,000+7.9%$262/sqft |
Source: MLS PIN #72380850 Report a problem | ||
| 10/11/2018 | Listing removed | $315,000$242/sqft |
Source: Financial Group Realty #72380850 Report a problem | ||
| 10/3/2018 | Pending sale | $315,000$242/sqft |
Source: Financial Group Realty #72380850 Report a problem | ||
| 9/13/2018 | Listed for sale | $315,000$242/sqft |
Source: Financial Group Realty #72380850 Report a problem | ||
| 9/4/2018 | Pending sale | $315,000$242/sqft |
Source: Financial Group Realty #72380850 Report a problem | ||
| 8/17/2018 | Listed for sale | $315,000$242/sqft |
Source: Financial Group Realty #72380850 Report a problem | ||
| 1/4/2018 | Listing removed | $315,000$242/sqft |
Source: Financial Group Realty #72205646 Report a problem | ||
| 12/26/2017 | Pending sale | $315,000$242/sqft |
Source: Financial Group Realty #72205646 Report a problem | ||
| 11/21/2017 | Price change | $315,000-1.5%$242/sqft |
Source: Financial Group Realty #72205646 Report a problem | ||
| 9/18/2017 | Listed for sale | $319,900$246/sqft |
Source: Financial Group Realty #72205646 Report a problem | ||
| 9/11/2017 | Pending sale | $319,900$246/sqft |
Source: Financial Group Realty #72205646 Report a problem | ||
| 7/29/2017 | Listed for sale | $319,900+61.6%$246/sqft |
Source: Financial Group Realty #72205646 Report a problem | ||
| 12/13/2016 | Sold | $198,000+16.5%$152/sqft |
Source: Public Record Report a problem | ||
| 4/29/2011 | Sold | $169,900$131/sqft |
Source: Public Record Report a problem | ||
| 2/18/2011 | Listed for sale | $169,900$131/sqft |
Source: Ellen D. Shultz #71130658 Report a problem | ||
Public tax history
| Year | Property taxes | Tax assessment |
|---|---|---|
| 2025 | $5,312 +2.1% | $457,500 +0.6% |
| 2024 | $5,205 +6.9% | $454,600 +12.8% |
| 2023 | $4,868 +3% | $403,000 +16% |
| 2022 | $4,725 +6.9% | $347,400 +16.1% |
| 2021 | $4,421 +1.8% | $299,100 +2.7% |
| 2020 | $4,342 +4.4% | $291,200 +4.9% |
| 2019 | $4,160 +11.9% | $277,700 +18.6% |
| 2018 | $3,719 -1.6% | $234,200 +0.3% |
| 2017 | $3,780 +3.1% | $233,600 +10.8% |
| 2016 | $3,668 +3.6% | $210,900 +7.8% |
| 2015 | $3,542 +16.7% | $195,700 +17.1% |
| 2014 | $3,036 +3.4% | $167,100 -1.2% |
| 2013 | $2,936 -9.2% | $169,200 -16.1% |
| 2012 | $3,233 +3.6% | $201,700 |
| 2011 | $3,120 +2.3% | $201,700 -7.8% |
| 2010 | $3,050 +2.3% | $218,800 -8.9% |
| 2009 | $2,982 +14.5% | $240,100 -11.7% |
| 2008 | $2,604 +3.8% | $271,800 -0.1% |
| 2007 | $2,508 +16% | $272,000 +23.9% |
| 2006 | $2,163 +3.5% | $219,600 +3% |
| 2005 | $2,089 -11.6% | $213,200 |
| 2004 | $2,362 +15.4% | $213,200 +31.9% |
| 2003 | $2,047 +17.1% | $161,600 +61.4% |
| 2001 | $1,748 +12.1% | $100,116 +2.6% |
| 1997 | $1,560 | $97,600 |
Find assessor info on the county website
Monthly payment
Est. payment
Payment breakdown
Explore the cost of this home by adjusting the details. Changes won't be saved.Climate risks
Neighborhood: 02368

Similar homes
- $591,0003 bd2 ba1.1k sqft48 Woodlawn St, Randolph, MA 02368For Sale
 MLS ID #73557023, Daniel Beirne, OpenDoor Brokerage LLC. MLS PIN
- $725,0004 bd2 ba1.8k sqft24 Vinton St, Randolph, MA 02368For Sale
 MLS ID #73599199, Jacob Sloane, Coldwell Banker Realty - Belmont. MLS PIN
- $600,0003 bd2 ba1.5k sqft3 Swan Ave, Weymouth, MA 02190For Sale
 MLS ID #73599858, Miller Real Estate Group, Keller Williams Pinnacle Central. MLS PIN
- $579,0003 bd2 ba1.1k sqft117 Healey Ter, Brockton, MA 02301For Sale
 MLS ID #73595255, Jeanie E. Martins, Martins & Associates R.E. Inc.. MLS PIN
