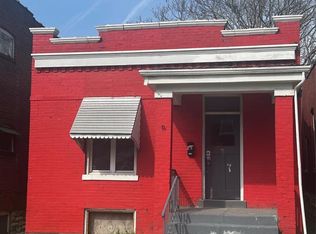
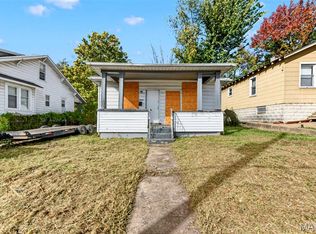
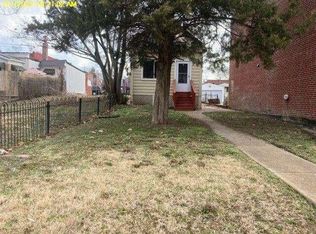
$--
2 bd2 ba1k sqft
4110 Oregon Ave, Saint Louis, MO 63118
Sold

Zillow last checked:
Listing updated:
Kati A Underwood 636-212-1554,
Equity Missouri LLC
 Originating MLS: St. Louis Association of REALTORS
Not available
Estimated sales range
Not available
$1,156/mo
| Date | Event | Price |
|---|---|---|
| 11/2/2026 | Contingent | $34,900$48/sqft |
Source:  MARIS #26070145 Report a problem | ||
| 11/2/2026 | Listed for sale | $34,900+22.5%$48/sqft |
Source: MARIS #26070145 Report a problem | ||
| 9/10/2021 | Sold | -- |
Source: MARIS #21031780 Report a problem | ||
| 8/2/2021 | Listing removed | -- |
Source: Zillow Rental Manager Report a problem | ||
| 7/21/2021 | Listed for rent | $825$1/sqft |
Source: Zillow Rental Manager Report a problem | ||
| 7/2/2021 | Listing removed | -- |
Source: Zillow Rental Manager Report a problem | ||
| 6/20/2021 | Listed for rent | $825$1/sqft |
Source: Zillow Rental Manager Report a problem | ||
| 6/1/2021 | Listing removed | -- |
Source: Zillow Rental Manager Report a problem | ||
| 5/24/2021 | Listed for rent | $825$1/sqft |
Source: Zillow Rental Manager Report a problem | ||
| 4/2/2021 | Sold | -- |
Source: MARIS #20089977 Report a problem | ||
| 3/2/2021 | Pending sale | $28,500$39/sqft |
Source: MARIS #20089977 Report a problem | ||
| 2/25/2021 | Listed for sale | $28,500$39/sqft |
Source: MARIS #20089977 Report a problem | ||
| 2/23/2021 | Pending sale | $28,500$39/sqft |
Source: MARIS #20089977 Report a problem | ||
| 2/12/2021 | Price change | $28,500-5%$39/sqft |
Source: MARIS #20089977 Report a problem | ||
| 2/2/2021 | Listed for sale | $30,000$41/sqft |
Source: MARIS #20089977 Report a problem | ||
| 1/27/2021 | Pending sale | $30,000$41/sqft |
Source: MARIS #20089977 Report a problem | ||
| 1/25/2021 | Listed for sale | $30,000$41/sqft |
Source: MARIS #20089977 Report a problem | ||
| 1/15/2021 | Pending sale | $30,000$41/sqft |
Source: MARIS #20089977 Report a problem | ||
| 1/15/2021 | Listed for sale | $30,000$41/sqft |
Source: MARIS #20089977 Report a problem | ||
| 1/11/2021 | Pending sale | $30,000$41/sqft |
Source: MARIS #20089977 Report a problem | ||
| 12/20/2020 | Listed for sale | $30,000$41/sqft |
Source: American Realty Group #20089977 Report a problem | ||
| 11/23/2020 | Sold | -- |
Source: Public Record Report a problem | ||
| 3/30/2020 | Sold | -- |
Source: Public Record Report a problem | ||
| 10/21/2004 | Sold | -- |
Source: Public Record Report a problem | ||
| 11/9/2000 | Sold | -- |
Source: Public Record Report a problem | ||
| Year | Property taxes | Tax assessment |
|---|---|---|
| 2025 | $972 +479.3% | $11,530 +590.4% |
| 2024 | $168 +4.3% | $1,670 |
| 2023 | $161 -50.6% | $1,670 -53.6% |
| 2022 | $326 +0.1% | $3,600 |
| 2021 | $325 +5.9% | $3,600 +5% |
| 2020 | $307 | $3,430 +0.3% |
| 2019 | $307 | $3,420 +4.6% |
| 2018 | $307 +1.3% | $3,270 |
| 2017 | $303 +0.4% | $3,270 |
| 2016 | $302 +9.4% | $3,270 |
| 2015 | $276 -1.8% | $3,270 |
| 2014 | $281 | $3,270 -2.4% |
| 2013 | $281 | $3,350 -33.7% |
| 2012 | -- | $5,050 |
| 2011 | -- | $5,050 |
| 2010 | -- | $5,050 -13.5% |
| 2009 | $416 +38.4% | $5,840 |
| 2008 | $301 | $5,840 -10.7% |
| 2007 | $301 | $6,540 |
| 2006 | $301 +0.9% | $6,540 +67.7% |
| 2005 | $298 +11.7% | $3,900 +19.3% |
| 2004 | $267 +2.7% | $3,270 |
| 2003 | $260 +7.2% | $3,270 +10.8% |
| 2002 | $242 | $2,950 |
| 2001 | -- | $2,950 +11.7% |
| 2000 | -- | $2,640 |
Source: MARIS. This data may not be complete. We recommend contacting the local school district to confirm school assignments for this home.
A local agent can set up tours, give advice and negotiate with sellers.
A local lender can help you make sure your offer is ready when you are.