$331,500
-- bd|2 ba|2k sqft
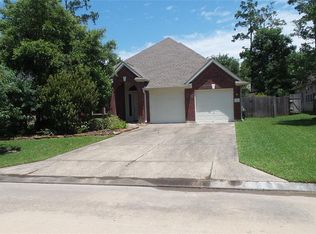
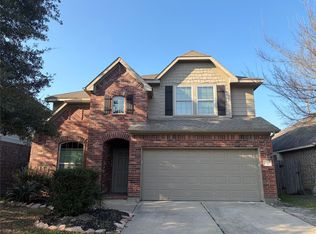
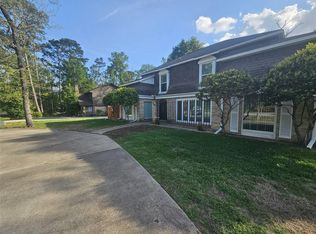
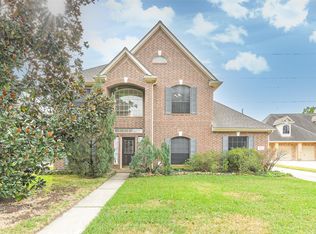
38 Drifting Shadows Cir, Conroe, TX 77385
Off Market
Zillow last checked:
Listing updated:
Rhonda Fitch TREC #0822885 832-489-8108,
Ideal Realty
$372,000
$353,000 - $391,000
$2,413/mo
| Date | Event | Price |
|---|---|---|
| 6/3/2026 | Price change | $380,000-3.8%$161/sqft |
Source: | ||
| 5/1/2026 | Listed for sale | $395,000$168/sqft |
Source: | ||
| 3/6/2026 | Price change | $2,295-4.2%$1/sqft |
Source: | ||
| 1/21/2026 | Listed for rent | $2,395+4.4%$1/sqft |
Source: | ||
| 12/14/2022 | Listing removed | -- |
Source: Zillow Rentals Report a problem | ||
| 12/8/2022 | Price change | $2,295+4.6%$1/sqft |
Source: Zillow Rentals Report a problem | ||
| 11/11/2022 | Price change | $2,195-4.4%$1/sqft |
Source: Zillow Rental Network_1 #26875857 Report a problem | ||
| 10/20/2022 | Listed for rent | $2,295+35.4%$1/sqft |
Source: Zillow Rental Manager Report a problem | ||
| 4/2/2019 | Listing removed | $1,695$1/sqft |
Source: RE/MAX The Woodlands & Spring #32885872 Report a problem | ||
| 3/27/2019 | Listed for rent | $1,695$1/sqft |
Source: RE/MAX The Woodlands & Spring #32885872 Report a problem | ||
| 2/6/2019 | Listing removed | $1,695$1/sqft |
Source: RE/MAX The Woodlands & Spring #32885872 Report a problem | ||
| 12/4/2018 | Listed for rent | $1,695+2.7%$1/sqft |
Source: RE/MAX The Woodlands & Spring #32885872 Report a problem | ||
| 8/2/2016 | Listing removed | $1,650+3.4%$1/sqft |
Source: Zillow Rental Manager Report a problem | ||
| 10/3/2012 | Listing removed | $1,595$1/sqft |
Source: RE/MAX The Woodlands And Spring 1 #76676741 Report a problem | ||
| 9/20/2012 | Price change | $1,595-5.9%$1/sqft |
Source: RE/MAX The Woodlands And Spring 1 #76676741 Report a problem | ||
| 9/3/2012 | Price change | $1,695-10.6%$1/sqft |
Source: RE/MAX The Woodlands And Spring 1 #76676741 Report a problem | ||
| 8/7/2012 | Listed for rent | $1,895$1/sqft |
Source: RE/MAX The Woodlands And Spring 1 #76676741 Report a problem | ||
| Year | Property taxes | Tax assessment |
|---|---|---|
| 2025 | $5,455 -2.4% | $330,370 -2.1% |
| 2024 | $5,592 -1.2% | $337,401 -1.1% |
| 2023 | $5,662 | $341,000 +15.6% |
| 2022 | -- | $295,000 +21.4% |
| 2021 | $4,792 | $243,000 -1.2% |
| 2020 | -- | $245,860 +6.8% |
| 2019 | $4,715 -12.6% | $230,190 +6.6% |
| 2018 | $5,393 -6.4% | $216,000 -6.1% |
| 2017 | $5,764 +8.2% | $230,000 +8.6% |
| 2016 | $5,329 +12.3% | $211,800 +0.2% |
| 2015 | $4,746 | $211,340 +15.9% |
| 2014 | $4,746 | $182,370 +10.7% |
| 2013 | -- | $164,800 |
| 2012 | -- | $164,800 |
| 2011 | -- | $164,800 |
| 2010 | -- | $164,800 |
| 2009 | -- | $164,800 |
| 2008 | -- | $164,800 +0.9% |
| 2007 | -- | $163,250 +6.3% |
| 2006 | -- | $153,510 +1.3% |
| 2005 | -- | $151,510 +3.7% |
| 2004 | -- | $146,110 +47.2% |
| 2003 | -- | $99,260 +422.4% |
| 2002 | -- | $19,000 +300% |
| 2001 | -- | $4,750 |
Find assessor info on the county website
Source: HAR. This data may not be complete. We recommend contacting the local school district to confirm school assignments for this home.
A local agent can set up tours, give advice and negotiate with sellers.