Hardwood floor, double pane windows, huge yard. Priced to sell quick, bring your check book
Pending
$159,900
43 Pinehurst Ave, Brockton, MA 02302
3beds
1,010sqft
Single Family Residence
Built in 1981
8,451 Square Feet Lot
$540,200 Zestimate®
$158/sqft
$-- HOA
What's special
- 309 days
- 17
- 0
Zillow last checked:
Listing updated:
Listed by:
Max Moise 617-892-2761,
RE/MAX Landmark, REALTORS® 781-341-6100
Source: MLS PIN,MLS#: 71862280
Facts & features
Interior
Bedrooms & bathrooms
- Bedrooms: 3
- Bathrooms: 1
- Full bathrooms: 1
Heating
- Central, Forced Air, Natural Gas
Cooling
- Central Air
Appliances
- Included: Gas Water Heater, Range, Microwave
Features
- Flooring: Wood
- Windows: Insulated Windows
- Basement: Full,Finished
- Has fireplace: No
Interior area
- Total structure area: 1,010
- Total interior livable area: 1,010 sqft
Property
Parking
- Total spaces: 2
- Parking features: Off Street
- Uncovered spaces: 2
Lot
- Size: 8,451 Square Feet
- Features: Wooded
Details
- Parcel number: 969493
- Zoning: Res.
- Special conditions: Short Sale
Construction
Type & style
- Home type: SingleFamily
- Architectural style: Ranch
- Property subtype: Single Family Residence
Materials
- Frame
- Foundation: Concrete Perimeter
- Roof: Shingle
Condition
- Year built: 1981
Utilities & green energy
- Electric: 110 Volts
- Sewer: Public Sewer
- Water: Public
- Utilities for property: for Gas Range
Community & HOA
HOA
- Has HOA: No
Location
- Region: Brockton
Financial & listing details
- Price per square foot: $158/sqft
- Tax assessed value: $161,800
- Annual tax amount: $2,936
- Date on market: 12/31/2025
- Listing terms: Lender Approval Required
Estimated market value
$540,200
$513,000 - $567,000
$3,135/mo
Price history
| Date | Event | Price |
|---|---|---|
| 9/23/2026 | Pending sale | $159,900-56.8%$158/sqft |
Source: MLS PIN #71862280 Report a problem | ||
| 11/3/2020 | Listing removed | $369,900$366/sqft |
Source: Ballow and Hutchinson Realty Group, Inc. #72743888 Report a problem | ||
| 10/20/2020 | Pending sale | $369,900$366/sqft |
Source: Ballow and Hutchinson Realty Group, Inc. #72743888 Report a problem | ||
| 10/16/2020 | Listed for sale | $369,900+84.9%$366/sqft |
Source: Ballow and Hutchinson Realty Group, Inc. #72743888 Report a problem | ||
| 10/29/2019 | Sold | $200,025-13%$198/sqft |
Source: Public Record Report a problem | ||
| 8/24/2019 | Listed for sale | $230,000-20.7%$228/sqft |
Source: Vylla Home #72553931 Report a problem | ||
| 12/16/2016 | Sold | $290,128+93.5%$287/sqft |
Source: Public Record Report a problem | ||
| 9/27/2016 | Price change | $149,900-6.3%$148/sqft |
Source: RE/MAX Landmark, REALTORS� #71862280 Report a problem | ||
| 9/23/2016 | Pending sale | $159,900$158/sqft |
Source: RE/MAX Landmark, REALTORS� #71862280 Report a problem | ||
| 9/23/2016 | Listed for sale | $159,900$158/sqft |
Source: RE/MAX Landmark, REALTORS� #71862280 Report a problem | ||
| 3/21/2016 | Listing removed | $159,900$158/sqft |
Source: RE/MAX Landmark, REALTORS� #71862280 Report a problem | ||
| 3/21/2016 | Pending sale | $159,900$158/sqft |
Source: RE/MAX Landmark, REALTORS� #71862280 Report a problem | ||
| 2/2/2016 | Listed for sale | $159,900+6.7%$158/sqft |
Source: RE/MAX Landmark, REALTORS� #71862280 Report a problem | ||
| 6/25/2015 | Pending sale | $149,900$148/sqft |
Source: RE/MAX Landmark, Realtors #71862280 Report a problem | ||
| 6/23/2015 | Listed for sale | $149,900+16.2%$148/sqft |
Source: RE/MAX Landmark, REALTORS� #71862280 Report a problem | ||
| 6/17/2014 | Listing removed | $129,000$128/sqft |
Source: RE/MAX Landmark, Realtors #71696519 Report a problem | ||
| 6/10/2014 | Listed for sale | $129,000+17.4%$128/sqft |
Source: RE/MAX Landmark, REALTORS� #71696519 Report a problem | ||
| 12/28/2012 | Listing removed | $109,900$109/sqft |
Source: Next Level Realty #71449824 Report a problem | ||
| 10/22/2012 | Listed for sale | $109,900-45%$109/sqft |
Source: Next Level Realty #71449824 Report a problem | ||
| 5/29/2008 | Listing removed | $199,990$198/sqft |
Source: MLS Property Information Network #70756280 Report a problem | ||
| 5/28/2008 | Listed for sale | $199,990-27.3%$198/sqft |
Source: MLS Property Information Network #70756280 Report a problem | ||
| 3/27/2006 | Sold | $275,000+71.9%$272/sqft |
Source: Public Record Report a problem | ||
| 11/7/2000 | Sold | $160,000+51.1%$158/sqft |
Source: Public Record Report a problem | ||
| 12/2/1996 | Sold | $105,900-13.1%$105/sqft |
Source: Public Record Report a problem | ||
| 6/25/1987 | Sold | $121,900$121/sqft |
Source: Public Record Report a problem | ||
Public tax history
| Year | Property taxes | Tax assessment |
|---|---|---|
| 2025 | $5,898 +5% | $487,000 +4.2% |
| 2024 | $5,616 +5.2% | $467,200 +13.6% |
| 2023 | $5,337 +4.8% | $411,200 +12.8% |
| 2022 | $5,093 +23.2% | $364,600 +27.9% |
| 2021 | $4,134 +5.1% | $285,100 +9.8% |
| 2020 | $3,934 +10.6% | $259,700 +13.5% |
| 2019 | $3,557 +1.8% | $228,900 +5.2% |
| 2018 | $3,493 +6.1% | $217,500 +6.4% |
| 2017 | $3,291 +0.5% | $204,400 +8.3% |
| 2016 | $3,276 +11.5% | $188,700 +16.6% |
| 2015 | $2,937 -4.3% | $161,800 -4.4% |
| 2014 | $3,069 -1.3% | $169,300 -8.1% |
| 2013 | $3,109 +0.7% | $184,200 -3.7% |
| 2012 | $3,086 +6.2% | $191,200 +0.6% |
| 2011 | $2,907 +16.9% | $190,100 +5.3% |
| 2010 | $2,487 -1.4% | $180,600 -20.5% |
| 2009 | $2,522 +3.9% | $227,200 -10.1% |
| 2008 | $2,427 +0.7% | $252,800 -1.4% |
| 2007 | $2,409 +3.7% | $256,500 +5.4% |
| 2006 | $2,322 -3.7% | $243,400 +7.3% |
| 2005 | $2,410 +3.7% | $226,900 +12.3% |
| 2004 | $2,325 +10.5% | $202,000 +21.3% |
| 2003 | $2,105 +3.3% | $166,500 +13.7% |
| 2002 | $2,038 +20% | $146,500 +55.9% |
| 2000 | $1,698 | $94,000 |
Find assessor info on the county website
Monthly payment
Est. payment
Payment breakdown
Explore the cost of this home by adjusting the details. Changes won't be saved.Climate risks
Neighborhood: 02302

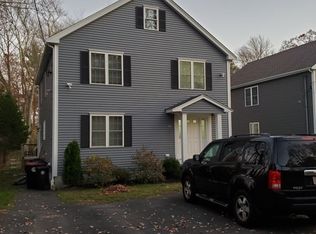
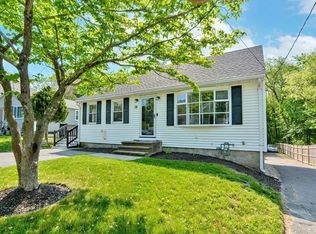
Similar homes
- $159,9003 bd1 ba910 sqft5 Alpine St, Rockland, MA 02370For Sale
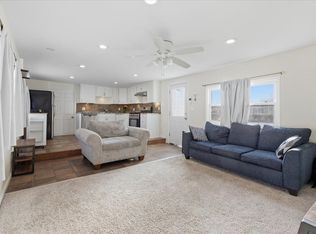 MLS ID #73594825, Watson Homes Team, RE/MAX Real Estate Center. MLS PIN
- $189,0003 bd2 ba1.2k sqft16 Liberty St, West Bridgewater, MA 02379For Sale
 MLS ID #73586767, JEP Realty Team, Real Broker Ma, LLC. MLS PIN
- $175,0002 bd1 ba980 sqft305 Turnpike St Trailer 225, South Easton, MA 02375For Sale
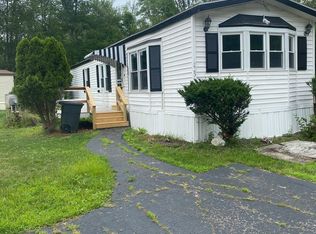 MLS ID #73595248, Kyle Seyboth, Century 21 Limitless. MLS PIN
- $168,0002 bd1 ba920 sqft214 Washington St Trailer 1, Norwell, MA 02061For Sale
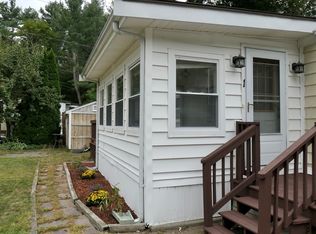 MLS ID #73586046, Sheri Bauman-Hoitt, William Raveis R.E. & Home Services. MLS PIN
