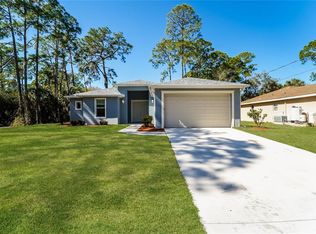
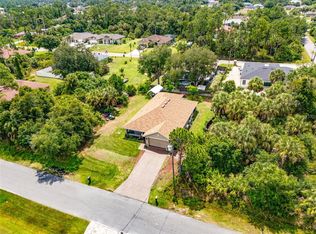
This 1467 square foot single family home has 3 bedrooms and 2.0 bathrooms. This home is located at 4461 Badosa Rd, North Port, FL 34286.
Pre-foreclosure
Street View
Est. $301,400
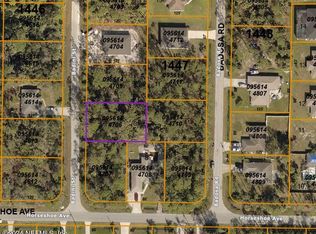
4461 Badosa Rd, North Port, FL 34286
3beds
1,467sqft
SingleFamily
Built in 2017
0.25 Acres Lot
$301,400 Zestimate®
$205/sqft
$-- HOA
Overview
- 311 days |
- 6 |
- 0 |
Facts & features
Interior
Bedrooms & bathrooms
- Bedrooms: 3
- Bathrooms: 2
- Full bathrooms: 2
Heating
- Other
Appliances
- Included: Dishwasher, Garbage disposal, Microwave, Range / Oven, Refrigerator
Features
- Flooring: Tile
- Basement: None
- Has fireplace: No
Interior area
- Total interior livable area: 1,467 sqft
Property
Parking
- Parking features: Garage - Attached
Features
- On waterfront: Yes
Lot
- Size: 0.25 Acres
Details
- Parcel number: 0956144713
Construction
Type & style
- Home type: SingleFamily
Materials
- masonry
- Foundation: Concrete
- Roof: Asphalt
Condition
- Year built: 2017
Community & HOA
Location
- Region: North Port
Financial & listing details
- Price per square foot: $205/sqft
- Tax assessed value: $246,200
- Annual tax amount: $2,969
Visit our professional directory to find a foreclosure specialist in your area that can help with your home search.
Find a foreclosure agentForeclosure details
Estimated market value
$301,400
$283,000 - $319,000
$1,927/mo
Price history
| Date | Event | Price |
|---|---|---|
| 10/25/2017 | Sold | $191,700$131/sqft |
Source: Public Record Report a problem | ||
Public tax history
| Year | Property taxes | Tax assessment |
|---|---|---|
| 2025 | $2,969 +5.3% | $176,041 +2.9% |
| 2024 | $2,820 +4.8% | $171,080 +3% |
| 2023 | $2,692 +3.2% | $166,097 +3% |
| 2022 | $2,607 +2.4% | $161,259 +3% |
| 2021 | $2,545 +1.3% | $156,562 +1.4% |
| 2020 | $2,512 +1.9% | $154,400 +2% |
| 2019 | $2,464 | $151,400 -2.1% |
| 2018 | $2,464 +3% | $154,700 +2875% |
| 2017 | $2,393 +573% | $5,200 +8.3% |
| 2016 | $356 +0.3% | $4,800 +11.6% |
| 2015 | $355 -0.3% | $4,300 +53.6% |
| 2014 | $356 +8.2% | $2,800 |
| 2013 | $329 +35.9% | $2,800 +3.7% |
| 2012 | $242 -1.9% | $2,700 -18.2% |
| 2011 | $246 -7% | $3,300 -25% |
| 2010 | $265 -28.3% | $4,400 -34.3% |
| 2009 | $369 | $6,700 -33% |
| 2008 | $369 -46.5% | $10,000 -70.9% |
| 2007 | $690 | $34,400 -2% |
| 2006 | -- | $35,100 +137.2% |
| 2005 | -- | $14,800 +393.3% |
| 2004 | $136 +22.9% | $3,000 +87.5% |
| 2003 | $111 +0.1% | $1,600 |
| 2002 | $111 +3.9% | $1,600 |
| 2001 | $107 -0.2% | $1,600 |
| 2000 | $107 | $1,600 |
Find assessor info on the county website
Monthly payment
Estimated monthly payment$1,822
All calculations are estimates and provided by Zillow, Inc. for informational purposes only. Actual amounts may vary.
HOA fees may include property taxes on listings classified as Co-Ops. Contact the listing agent and/or owner for fee details.
Mortgage interest rates are dependent on a number of factors, including credit score, down payment, and repayment length. Interest rate data provided by Zillow Group Marketplace, Inc. as of 1/1/1970 from various mortgage lenders with which we have lead or other similar arrangements; the Estimated Payment is an average of those rates.
See how much you could borrow to make a competitive offer.
Climate risks
Neighborhood: 34286
Nearby schools
GreatSchools rating
- 6/10Lamarque Elementary SchoolGrades: PK-5Distance: 0.7 mi
- 6/10Woodland Middle SchoolGrades: 6-8Distance: 5 mi
- 3/10North Port High SchoolGrades: PK,9-12Distance: 2.2 mi


- Florida
- Sarasota County
- North Port
- 34286
- 4461 Badosa Rd
Nearby cities
Nearby neighborhoods
Nearby zip codes
Other North Port Topics
