4631 Oregon Ave is a 4 bed 2 bath single family home in Saint Louis, MO 63111 totaling 1,874 sq ft located within the St. Louis City Public School System. This property was recently updated with modern finishes and includes a backyard. This property is currently leased for $1,500/m through 2/28/2027.
Active
Listed by: Salient Realty Group, LLC • Matt G Millslagle • 314-323-3340
$200,000
4631 Oregon Ave, Saint Louis, MO 63111
4beds
1,874sqft
Single Family Residence
Built in 1904
3,598 Square Feet Lot
$-- Zestimate®
$107/sqft
$-- HOA
What's special
- 45 days
- 102
- 9
Zillow last checked:
Listing updated:
Listed by:
Matt G Millslagle 314-323-3340,
Salient Realty Group, LLC,
Tyler Alms,
Salient Realty Group, LLC
Source: MARIS,MLS#: 26062337 Originating MLS: St. Louis Association of REALTORS
Facts & features
Interior
Bedrooms & bathrooms
- Bedrooms: 4
- Bathrooms: 2
- Full bathrooms: 2
- Main level bathrooms: 2
- Main level bedrooms: 3
Heating
- Forced Air
Cooling
- Central Air
Features
- Basement: Unfinished
- Has fireplace: No
Interior area
- Total structure area: 1,874
- Total interior livable area: 1,874 sqft
- Finished area above ground: 1,874
Property
Features
- Levels: Two
Lot
- Size: 3,598 Square Feet
- Features: Back Yard, Front Yard
Details
- Parcel number: 27490002200
- Special conditions: Standard
Construction
Type & style
- Home type: SingleFamily
- Architectural style: Other
- Property subtype: Single Family Residence
Materials
- Brick
Condition
- Year built: 1904
Utilities & green energy
- Electric: Single Phase
- Sewer: Public Sewer
- Water: Public
- Utilities for property: Electricity Connected, Sewer Connected, Water Connected
Community & HOA
Community
- Subdivision: St Louis Commons Add
HOA
- Has HOA: No
Location
- Region: Saint Louis
Financial & listing details
- Price per square foot: $107/sqft
- Tax assessed value: $25,790
- Annual tax amount: $2,139
- Date on market: 9/29/2026
- Listing terms: Conventional
- Electric utility on property: Yes
Estimated market value
Not available
Estimated sales range
Not available
Not available
Price history
| Date | Event | Price |
|---|---|---|
| 9/29/2026 | Listed for sale | $200,000+21.3%$107/sqft |
Source:  MARIS #26062337 Report a problem | ||
| 2/27/2026 | Listing removed | $1,700$1/sqft |
Source: Zillow Rentals Report a problem | ||
| 1/31/2026 | Listed for rent | $1,700+0.3%$1/sqft |
Source: Zillow Rentals Report a problem | ||
| 11/4/2025 | Sold | -- |
Source: MARIS #25044779 Report a problem | ||
| 10/29/2025 | Pending sale | $164,900$88/sqft |
Source: MARIS #25044779 Report a problem | ||
| 8/26/2025 | Price change | $164,900-7.9%$88/sqft |
Source: MARIS #25044779 Report a problem | ||
| 8/26/2025 | Listing removed | $1,695$1/sqft |
Source: Zillow Rentals Report a problem | ||
| 7/31/2025 | Price change | $1,695-3.1%$1/sqft |
Source: Zillow Rentals Report a problem | ||
| 6/28/2025 | Listed for sale | $179,000+2.3%$96/sqft |
Source: MARIS #25044779 Report a problem | ||
| 6/20/2025 | Listed for rent | $1,750+6.1%$1/sqft |
Source: Zillow Rentals Report a problem | ||
| 5/6/2025 | Listing removed | $175,000$93/sqft |
Source: MARIS #24074678 Report a problem | ||
| 1/28/2025 | Price change | $175,000-7.9%$93/sqft |
Source: MARIS #24074678 Report a problem | ||
| 12/11/2024 | Listed for sale | $190,000+2.7%$101/sqft |
Source: MARIS #24074678 Report a problem | ||
| 7/19/2024 | Listing removed | $185,000$99/sqft |
Source: MARIS #24041752 Report a problem | ||
| 7/2/2024 | Listed for sale | $185,000-2.6%$99/sqft |
Source: MARIS #24041752 Report a problem | ||
| 6/23/2024 | Listing removed | -- |
Source: MARIS #24018303 Report a problem | ||
| 4/10/2024 | Listed for sale | $190,000+91.9%$101/sqft |
Source: MARIS #24018303 Report a problem | ||
| 2/11/2023 | Listing removed | -- |
Source: Zillow Rentals Report a problem | ||
| 12/31/2022 | Listed for rent | $1,650+74.6%$1/sqft |
Source: Zillow Rentals Report a problem | ||
| 2/9/2022 | Sold | -- |
Source: MARIS #21071793 Report a problem | ||
| 1/16/2022 | Pending sale | $99,000$53/sqft |
Source: MARIS #21071793 Report a problem | ||
| 12/31/2021 | Price change | $99,000-17.4%$53/sqft |
Source: MARIS #21071793 Report a problem | ||
| 12/22/2021 | Pending sale | $119,900$64/sqft |
Source: MARIS #21071793 Report a problem | ||
| 10/5/2021 | Listed for sale | $119,900$64/sqft |
Source: MARIS #21071793 Report a problem | ||
| 10/30/2019 | Listing removed | $945$1/sqft |
Source: Zillow Rental Network Report a problem | ||
| 9/30/2019 | Listed for rent | $945$1/sqft |
Source: Zillow Rental Network Report a problem | ||
| 4/11/2019 | Sold | -- |
Source: Public Record Report a problem | ||
| 4/5/2018 | Sold | -- |
Source: Public Record Report a problem | ||
Public tax history
| Year | Property taxes | Tax assessment |
|---|---|---|
| 2025 | $2,139 +21% | $25,790 +24.1% |
| 2024 | $1,768 +5.1% | $20,790 |
| 2023 | $1,683 +16.3% | $20,790 +21.1% |
| 2022 | $1,447 -5.1% | $17,170 -5.3% |
| 2021 | $1,525 +5.9% | $18,140 +4.8% |
| 2020 | $1,441 | $17,310 |
| 2019 | $1,441 | $17,310 +50% |
| 2018 | $1,441 +44.2% | $11,540 +0.1% |
| 2017 | $999 -8.4% | $11,530 -9% |
| 2016 | $1,090 +10.1% | $12,670 -0.1% |
| 2015 | $990 -1.2% | $12,680 |
| 2014 | $1,001 | $12,680 -1.2% |
| 2013 | $1,001 | $12,830 -14.1% |
| 2012 | -- | $14,930 |
| 2011 | -- | $14,930 |
| 2010 | -- | $14,930 -6.7% |
| 2009 | $1,092 +12.3% | $16,010 |
| 2008 | $972 | $16,010 -7% |
| 2007 | $972 | $17,210 |
| 2006 | $972 +1% | $17,210 +27.4% |
| 2005 | $963 +19.2% | $13,510 +26.5% |
| 2004 | $808 +2.9% | $10,680 |
| 2003 | $785 +13.9% | $10,680 +17.4% |
| 2002 | $689 | $9,100 |
| 2001 | -- | $9,100 +12.9% |
| 2000 | -- | $8,060 |
Find assessor info on the county website
Monthly payment
Est. payment
Payment breakdown
Explore the cost of this home by adjusting the details. Changes won't be saved.Climate risks
Neighborhood: Mount Pleasant
Nearby schools
Schools provided by the listing agent
- Elementary: Monroe Elem.
- Middle: Long Middle Community Ed. Center
- High: Roosevelt High
Source: MARIS. This data may not be complete. We recommend contacting the local school district to confirm school assignments for this home.


Similar homes
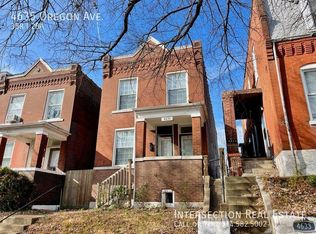
- $185,0004 bd2 ba2k sqft4312 Oregon Ave, Saint Louis, MO 63111For Sale

 MLS ID #26062330, Matt G Millslagle, Salient Realty Group, LLC. MARIS
- $199,9004 bd4 ba2.7k sqft4617 S Broadway, Saint Louis, MO 63111For Sale
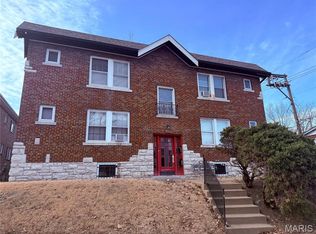 MLS ID #26064777, Brian C Miller, Mogul Realty. MARIS
- $180,0005 bd2 ba2.2k sqft4702 Minnesota Ave, Saint Louis, MO 63111For Sale
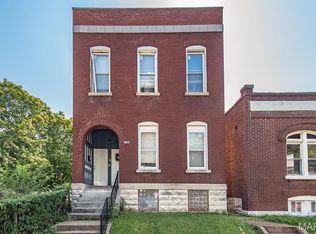 MLS ID #26054389, Joe W Hostman, RE/MAX Results. MARIS
- $195,0004 bd2 ba2.1k sqft3700 Osceola St, Saint Louis, MO 63116For Sale
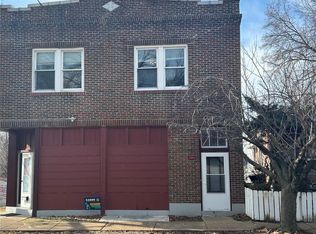 MLS ID #25081707, Nikki Stanojevic, Worth Clark Realty. MARIS
- $225,0002 bd2 ba2.1k sqft3444 Chippewa St, Saint Louis, MO 63118For SaleMLS ID #26048600, Laurie B Wuestling, Coldwell Banker Realty - Gundaker. MARIS
- $225,0004 bd2 ba2.2k sqft3638 Marceline Ter, Saint Louis, MO 63116For SaleMLS ID #26057038, Angela M Happle, Wood Brothers Realty. MARIS
- $129,5004 bd2 ba2.2k sqft3209 Delor St, Saint Louis, MO 63111For SaleMLS ID #26067682, Brittney M McClendon, BHHS Select Properties. MARIS
- $136,4403 bd1 ba1.3k sqft1012 Bates St, Saint Louis, MO 63111For SaleMLS ID #26001217, Joseph P LoPiccolo, American Realty Group. MARIS
- $129,9803 bd2 ba1.3k sqft6728 Alabama Ave, Saint Louis, MO 63111For SaleMLS ID #26060926, Yan Zhou, Platinum Arch Property, LLC. MARIS
- $149,9002 bd1 ba2.2k sqft4555 S Compton Ave, Saint Louis, MO 63111For SaleMLS ID #26044220, Cathy Dey Cooney, The Hermann London Group, Llc. MARIS
- $175,0004 bd2 ba2k sqft3819 Nebraska Ave, Saint Louis, MO 63118For SaleMLS ID #25066936, Jay Q Rios, Rivers Realty. MARIS
- $225,0004 bd3 ba1.7k sqft3104 Wyoming St, Saint Louis, MO 63118For SaleMLS ID #26055829, Tammy K Derrigan, Worth Clark Realty. MARIS
- $174,9002 bd1 ba1.1k sqft3440 Klocke St, Saint Louis, MO 63118For SaleMLS ID #26069320, Jonathan Minerick, HomeCoin.com. MARIS
- $139,9004 bd2 ba1.8k sqft426 Bowen St, Saint Louis, MO 63111For SaleMLS ID #26048130, Cesar Mendoza, Platinum Realty of St. Louis. MARIS
- $225,0003 bd2 ba1k sqft5363 Arsenal St, Saint Louis, MO 63139For SaleMLS ID #26062335, Matt G Millslagle, Salient Realty Group, LLC. MARIS
- $180,0004 bd2 ba1.7k sqft3012 Ohio Ave, Saint Louis, MO 63118For SaleMLS ID #26006071, Brueggemann Tadlock, Keller Williams Realty St. Louis. MARIS
- $285,0004 bd3 ba2k sqft3614 Iowa Ave, Saint Louis, MO 63118For SaleMLS ID #26062339, Matt G Millslagle, Salient Realty Group, LLC. MARIS
- $172,9002 bd2 ba1.9k sqft3440 Nebraska Ave, Saint Louis, MO 63118For SaleMLS ID #26049592, Joey R Schenck, Invest St. Louis. MARIS
- $249,9004 bd2 ba2.1k sqft3537 Minnesota Ave, Saint Louis, MO 63118For SaleMLS ID #26064670, Yuliana A Erazo Hidalgo, Real Broker LLC. MARIS
