This 1563 square foot single family home has 3 bedrooms and 2.0 bathrooms. This home is located at 4706 Rose Dr, Oceanside, CA 92056.
Pre-foreclosure
Street View
Est. $905,900
4706 Rose Dr, Oceanside, CA 92056
3beds
2baths
1,563sqft
SingleFamily
Built in 1987
8,859 Square Feet Lot
$905,900 Zestimate®
$580/sqft
$-- HOA
Overview
- 38 days
- 13
- 1
Facts & features
Interior
Bedrooms & bathrooms
- Bedrooms: 3
- Bathrooms: 2
Interior area
- Total interior livable area: 1,563 sqft
Property
Parking
- Total spaces: 2
Lot
- Size: 8,859 Square Feet
Details
- Parcel number: 1635303400
Construction
Type & style
- Home type: SingleFamily
Condition
- Year built: 1987
Community & HOA
Location
- Region: Oceanside
Financial & listing details
- Price per square foot: $580/sqft
- Tax assessed value: $563,481
Foreclosure details
Estimated market value
$905,900
$852,000 - $960,000
$4,289/mo
Price history
| Date | Event | Price |
|---|---|---|
| 3/10/2017 | Sold | $476,000$305/sqft |
Source: Public Record Report a problem | ||
Public tax history
| Year | Property taxes | Tax assessment |
|---|---|---|
| 2026 | -- | $563,481 +2% |
| 2025 | $6,213 +6.1% | $552,433 +2% |
| 2024 | $5,858 +2.5% | $541,602 +2% |
| 2023 | $5,716 +0.3% | $530,983 +2% |
| 2022 | $5,701 +2.3% | $520,572 +2% |
| 2021 | $5,572 +0.4% | $510,365 +1% |
| 2020 | $5,552 +1% | $505,132 +2% |
| 2019 | $5,498 +4.3% | $495,228 +2% |
| 2018 | $5,272 +149.4% | $485,519 +153.1% |
| 2017 | $2,114 +6.3% | $191,837 +2% |
| 2016 | $1,988 +0.4% | $188,076 +1.5% |
| 2015 | $1,980 +2.5% | $185,252 +2% |
| 2014 | $1,930 | $181,624 +0.5% |
| 2013 | -- | $180,804 +2% |
| 2012 | -- | $177,260 +2% |
| 2011 | -- | $173,785 +0.8% |
| 2010 | -- | $172,488 -0.2% |
| 2009 | -- | $172,899 +2% |
| 2008 | -- | $169,510 +2% |
| 2007 | -- | $166,187 +2% |
| 2006 | -- | $162,929 +2% |
| 2005 | -- | $159,735 +2% |
| 2004 | -- | $156,604 +1.9% |
| 2003 | -- | $153,735 +2% |
| 2002 | -- | $150,722 +2% |
| 2001 | -- | $147,767 |
Find assessor info on the county website
Monthly payment
Climate risks
Neighborhood: Peacock


Similar homes
- $809,0003 bd2 ba1.4k sqft1587 Avenida Oceano, Oceanside, CA 92056For Sale
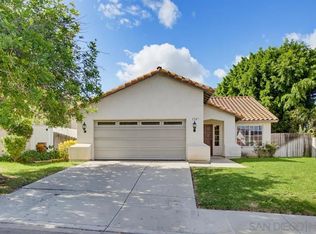 MLS ID #260026473, Emma Lefkowitz, Real Broker. SDMLS
- $899,0003 bd3 ba1.5k sqft1866 Via Primero, Oceanside, CA 92056For Sale
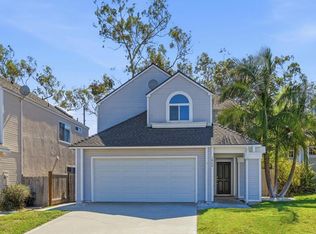 MLS ID #NDP2609307, Steven Lincoln, Lincoln Realty Group. CRMLS
- $799,0004 bd2 ba1.5k sqft3920 Sherbourne Dr, Oceanside, CA 92056For Sale
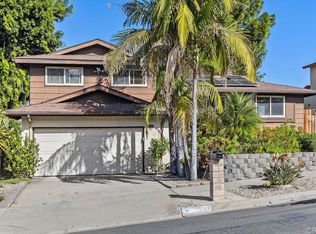 MLS ID #NDP2610058, Theresa Organ, Coldwell Banker Realty. CRMLS
- $939,0003 bd2 ba1.5k sqft1757 Henderson Ct, Vista, CA 92083For Sale
 MLS ID #NDP2610069, Gary Massa, eXp Realty of California, Inc. CRMLS
