3 BR/2 BA home. Only need is a cosmetic touch on the interior. This property is great for investors with great potential income or a buyer who wants a fun project. Just minutes from major highways and downtown Orlando. Home has a fenced-in backyard for privacy and a shed for storage. Roof & water heater were updated in 2020 and HVAC in 2014.
Pre-foreclosure
Est. $263,000
4830 NORWALK PLACE, ORLANDO, FL 32808
3beds
1,299sqft
Single Family Residence
Built in 1976
8,795 Square Feet Lot
$263,000 Zestimate®
$202/sqft
$-- HOA
Overview
- 357 days
- 27
- 0
Zillow last checked:
Listing updated:
Listed by:
Non-Member Agent,
STELLAR NON-MEMBER OFFICE 000-000-0000
Source: Stellar MLS,MLS#: J1000761 Originating MLS: Other
Facts & features
Interior
Bedrooms & bathrooms
- Bedrooms: 3
- Bathrooms: 2
- Full bathrooms: 2
Heating
- Central
Cooling
- Central Air
Appliances
- Included: Dishwasher, Range
- Laundry: In Garage
Features
- Has fireplace: No
Interior area
- Total structure area: 1,656
- Total interior livable area: 1,299 sqft
Property
Parking
- Total spaces: 2
- Parking features: Garage - Attached
- Attached garage spaces: 2
Features
- Levels: One
- Stories: 1
- Exterior features: Other
Lot
- Size: 8,795 Square Feet
Details
- Parcel number: 072229803203150
- Zoning: R-1A/W/RP
- Special conditions: None
Construction
Type & style
- Home type: SingleFamily
- Property subtype: Single Family Residence
Materials
- Block
- Foundation: Block
- Roof: Shingle
Condition
- New construction: No
- Year built: 1976
Utilities & green energy
- Sewer: Public Sewer
- Utilities for property: Electricity Connected, Water Connected
Community & HOA
Community
- Pet fee: $0 monthly
- Subdivision: SIGNAL HILL
Location
- Region: Orlando
Financial & listing details
- Price per square foot: $202/sqft
- Tax assessed value: $211,797
- Annual tax amount: $1,954
- Date on market: 5/8/2026
- Listing terms: FHA
- Ownership: Fee Simple
- Total actual rent: 0
- Electric utility on property: Yes
Foreclosure details
Estimated market value
$263,000
$242,000 - $287,000
$1,847/mo
Price history
| Date | Event | Price |
|---|---|---|
| 5/8/2026 | Sold | $270,000+8%$208/sqft |
Source:  Stellar MLS #J1000761 Report a problem | ||
| 9/30/2025 | Listing removed | $250,000$192/sqft |
Source: Stellar MLS #O6337823 Report a problem | ||
| 8/21/2025 | Listed for sale | $250,000$192/sqft |
Source: Stellar MLS #O6337823 Report a problem | ||
| 5/7/2025 | Listing removed | $250,000$192/sqft |
Source: Stellar MLS #O6187214 Report a problem | ||
| 4/11/2025 | Price change | $250,000-9.1%$192/sqft |
Source: Stellar MLS #O6187214 Report a problem | ||
| 11/1/2024 | Price change | $275,000-11.3%$212/sqft |
Source: Stellar MLS #O6187214 Report a problem | ||
| 9/1/2024 | Listed for sale | $310,000$239/sqft |
Source: Stellar MLS #O6187214 Report a problem | ||
| 3/31/2024 | Listing removed | $310,000$239/sqft |
Source: Stellar MLS #O6187214 Report a problem | ||
| 3/14/2024 | Listed for sale | $310,000+138.5%$239/sqft |
Source: Stellar MLS #O6187214 Report a problem | ||
| 2/17/2006 | Sold | $130,000$100/sqft |
Source: Public Record Report a problem | ||
Public tax history
| Year | Property taxes | Tax assessment |
|---|---|---|
| 2024 | $1,844 +8.1% | $131,779 +3% |
| 2023 | $1,706 +3.8% | $127,941 +3% |
| 2022 | $1,644 +2.4% | $124,215 +3% |
| 2021 | $1,606 +1.2% | $120,597 +1.4% |
| 2020 | $1,588 +1.6% | $118,932 +2.3% |
| 2019 | $1,562 +1.5% | $116,258 +1.9% |
| 2018 | $1,539 | $114,090 +30.7% |
| 2017 | $1,539 -1.9% | $87,319 +15.9% |
| 2016 | $1,569 +9.3% | $75,369 +4.6% |
| 2015 | $1,436 +20% | $72,054 +29.6% |
| 2014 | $1,196 +18.9% | $55,608 +22.6% |
| 2013 | $1,006 +6.1% | $45,347 +7.9% |
| 2012 | $948 +2% | $42,046 +2.7% |
| 2011 | $929 -12% | $40,922 -16.3% |
| 2010 | $1,055 | $48,876 -32.8% |
| 2009 | -- | $72,750 -35.4% |
| 2008 | $2,167 -6.2% | $112,577 -10.9% |
| 2007 | $2,309 +2.4% | $126,400 +11.7% |
| 2006 | $2,255 +16.2% | $113,197 +20.9% |
| 2005 | $1,941 +17.1% | $93,663 +15.6% |
| 2004 | $1,658 +1% | $81,028 +1.7% |
| 2003 | $1,641 +11.8% | $79,687 +12.4% |
| 2002 | $1,468 +68.6% | $70,925 +8.1% |
| 2001 | $871 +2.1% | $65,583 +4.9% |
| 2000 | $853 | $62,508 |
Find assessor info on the county website
Monthly payment
Climate risks
Neighborhood: Signal Hill

Similar homes
- $235,0003 bd2 ba1k sqft4864 STONY BROOK LANE, ORLANDO, FL 32808For Sale
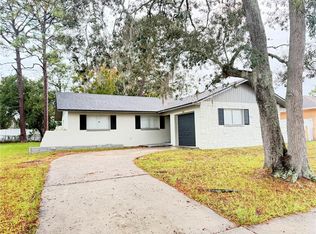
 MLS ID #O6455386, Stephanie Pelaez, NATIONAL REAL ESTATE. Stellar MLS
- $--3 bd2 ba1.2k sqft3600 Tam Dr, Orlando, FL 32808Auction
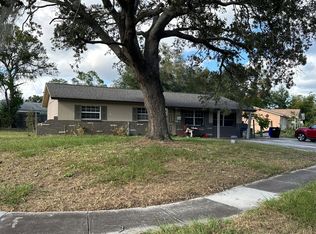 Auction.com 2
- $258,0003 bd2 ba998 sqft4522 WATCH HILL ROAD, ORLANDO, FL 32808For Sale
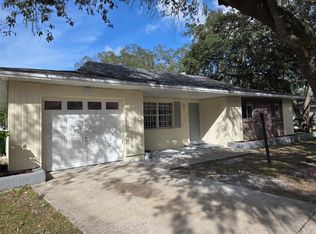 MLS ID #O6454128, Jeffery Jia, MARVIEW INTERNATIONAL REALTY LLC. Stellar MLS
- $289,9003 bd2 ba1.1k sqft4712 STONY BROOK LANE, ORLANDO, FL 32808For Sale
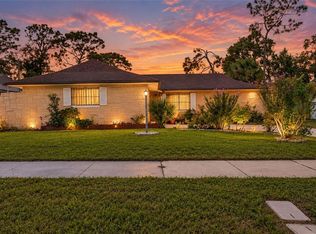 MLS ID #S5159230, Victoria Vahamonde, LA ROSA REALTY ORLANDO LLC. Stellar MLS
- $259,9003 bd2 ba1.4k sqft4221 ROBBINS AVENUE, ORLANDO, FL 32808For SaleMLS ID #O6455530, Teresa Homan, MAINSTAY BROKERAGE LLC. Stellar MLS
- $247,5003 bd2 ba960 sqft5818 FLORI LANE, ORLANDO, FL 32808For SaleMLS ID #O6434475, Jeff Jones, MARK SPAIN REAL ESTATE. Stellar MLS
- $275,0003 bd2 ba1k sqft4410 WATCH HILL ROAD, ORLANDO, FL 32808For SaleMLS ID #O6426189, Jasilyn Bing, BING REALTY CO.. Stellar MLS
- $269,9003 bd2 ba1.2k sqft3500 FORESTDALE DRIVE, ORLANDO, FL 32808For SaleMLS ID #O6454272, Linda Quach, CHARLES RUTENBERG REALTY ORLANDO. Stellar MLS
- $259,0003 bd2 ba1.4k sqft5903 RIVIERA DRIVE, ORLANDO, FL 32808For SaleMLS ID #O6434480, Gwen Hayslip, WEICHERT REALTORS HALLMARK PRO. Stellar MLS
- $260,0003 bd2 ba1.2k sqft5518 RIVIERA DRIVE, ORLANDO, FL 32808For SaleMLS ID #O6439117, Randy Pierre, LEMUEL PROPERTY MANAGEMENT LLC. Stellar MLS
- $245,0003 bd2 ba1.2k sqft4822 OKEEFE STREET, ORLANDO, FL 32808For SaleMLS ID #O6427590, Martha Grasty, EXP REALTY LLC. Stellar MLS
- $249,9903 bd2 ba1.2k sqft3913 PINE RIDGE ROAD, ORLANDO, FL 32808For SaleMLS ID #O6447604, Chris Soucy, REALTY ONE GROUP MVP. Stellar MLS
- $275,0004 bd2 ba1.2k sqft2410 SAVOY DRIVE, ORLANDO, FL 32808For SaleMLS ID #O6456495, Joseph Highsmith, Jr, RE/MAX PRIME PROPERTIES. Stellar MLS
- $289,9003 bd2 ba1.3k sqft4814 BLARNEY DRIVE, ORLANDO, FL 32808For SaleMLS ID #O6411122, Robert Salmons, ENTERA REALTY LLC. Stellar MLS
- $243,9003 bd2 ba1.3k sqft5312 COVENTRY DRIVE, ORLANDO, FL 32808For SaleMLS ID #O6438131, Loree Nichols, MAINSTAY BROKERAGE LLC. Stellar MLS
- $260,0003 bd2 ba1.6k sqft5910 INDIAN HILL ROAD, ORLANDO, FL 32808For SaleMLS ID #O6424205, Sonja Caraballo, MAPLEVEST REALTY. Stellar MLS
- $310,0003 bd2 ba1k sqft4173 SIGNAL HILL ROAD, ORLANDO, FL 32808For SaleMLS ID #G5105545, Rose Gachette, LA ROSA REALTY ORLANDO LLC. Stellar MLS
- $250,0003 bd2 ba1k sqft5839 HUTTON DRIVE, ORLANDO, FL 32808For SaleMLS ID #O6437537, John Vincent, JR REALTY GROUP LLC. Stellar MLS
- $280,0003 bd2 ba1.5k sqft3815 MITCHELL ROAD, ORLANDO, FL 32808For SaleMLS ID #O6424275, Abdias Alexandre, CENTRIC REALTY SERVICES LLC. Stellar MLS
- $265,0004 bd2 ba1.7k sqft5609 PERRINE DRIVE, ORLANDO, FL 32808For SaleMLS ID #O6439241, Chad Murray, EXP REALTY LLC. Stellar MLS
