Very well-maintained two-family home located in the sought-after North End. Each unit offers an eat-in kitchen, spacious living room, two bedrooms, and one full bathroom. The property features a finished basement, a private fenced-in backyard, and a driveway providing convenient off-street parking. Conveniently located close to hospitals, pharmacies, grocery stores, restaurants, and public transportation. A great opportunity for an owner-occupant or investor!
For sale
$669,900
487 Salem Street, Bridgeport, CT 06606
4beds
1,920sqft
Multi Family
Built in 1962
-- sqft lot
$-- Zestimate®
$349/sqft
$-- HOA
What's special
Finished basementEat-in kitchenTwo bedroomsPrivate fenced-in backyard
- 35 days
- 350
- 28
Zillow last checked:
Listing updated:
Listed by:
Rosania Melo (203)545-1459,
Rosana Melo Realty 203-545-1459
Source: Smart MLS,MLS#: 24207756
Facts & features
Interior
Bedrooms & bathrooms
- Bedrooms: 4
- Bathrooms: 2
- Full bathrooms: 2
Heating
- Forced Air, Natural Gas
Cooling
- Window Unit(s)
Appliances
- Included: Tankless Water Heater
Features
- Basement: Full,Finished
- Attic: Access Via Hatch
- Has fireplace: No
Interior area
- Total structure area: 1,920
- Total interior livable area: 1,920 sqft
- Finished area above ground: 1,920
Property
Parking
- Total spaces: 4
- Parking features: Driveway, Private
- Has uncovered spaces: Yes
Lot
- Size: 3,920 Square Feet
- Features: Level
Details
- Parcel number: 33216
- Zoning: RB
Construction
Type & style
- Home type: MultiFamily
- Architectural style: Units on different Floors
- Property subtype: Multi Family
Materials
- Vinyl Siding
- Foundation: Concrete Perimeter
- Roof: Asphalt
Condition
- New construction: No
- Year built: 1962
Utilities & green energy
- Sewer: Public Sewer
- Water: Public
Community & HOA
Community
- Subdivision: North End
HOA
- Has HOA: No
Location
- Region: Bridgeport
Financial & listing details
- Price per square foot: $349/sqft
- Tax assessed value: $185,760
- Annual tax amount: $8,071
- Date on market: 9/16/2026
Estimated market value
Not available
Estimated sales range
Not available
Not available
Price history
| Date | Event | Price |
|---|---|---|
| 9/16/2026 | Listed for sale | $669,900+41%$349/sqft |
Source:  Smart MLS #24207756 Report a problem | ||
| 6/11/2024 | Sold | $475,000+1.1%$247/sqft |
Source: Smart MLS #24008670 Report a problem | ||
| 4/18/2024 | Pending sale | $470,000$245/sqft |
Source: Smart MLS #24008670 Report a problem | ||
| 4/6/2024 | Listed for sale | $470,000+118.6%$245/sqft |
Source: Smart MLS #24008670 Report a problem | ||
| 11/8/2019 | Sold | $215,000-10%$112/sqft |
Source: Smart MLS #170235050 Report a problem | ||
| 10/23/2019 | Pending sale | $239,000$124/sqft |
Source: Real Living Wareck D'Ostilio #170235050 Report a problem | ||
| 10/16/2019 | Price change | $239,000-4%$124/sqft |
Source: Real Living Wareck D'Ostilio #170235050 Report a problem | ||
| 9/19/2019 | Listed for sale | $249,000-14.1%$130/sqft |
Source: Real Living Wareck D'Ostilio #170235050 Report a problem | ||
| 11/19/2014 | Listing removed | $1,275$1/sqft |
Source: Owner Report a problem | ||
| 10/20/2014 | Listed for rent | $1,275$1/sqft |
Source: Owner Report a problem | ||
| 11/15/2008 | Listing removed | $289,900$151/sqft |
Source: Listhub #B982883 Report a problem | ||
| 8/23/2008 | Listed for sale | $289,9000%$151/sqft |
Source: Listhub #B982883 Report a problem | ||
| 6/24/2008 | Listing removed | $290,000$151/sqft |
Source: Owner Report a problem | ||
| 1/24/2008 | Listed for sale | $290,000$151/sqft |
Source: Owner Report a problem | ||
Public tax history
| Year | Property taxes | Tax assessment |
|---|---|---|
| 2025 | $8,071 +7.9% | $185,760 +7.9% |
| 2024 | $7,479 | $172,120 |
| 2023 | $7,479 | $172,120 |
| 2022 | $7,479 | $172,120 |
| 2021 | $7,479 +11.9% | $172,120 +39% |
| 2020 | $6,684 | $123,800 |
| 2019 | $6,684 -0.7% | $123,800 |
| 2018 | $6,731 | $123,800 |
| 2017 | $6,731 | $123,800 |
| 2016 | $6,731 -3.8% | $123,800 -25.4% |
| 2015 | $6,999 | $165,860 |
| 2014 | $6,999 +0.8% | $165,860 |
| 2013 | $6,941 +1.8% | $165,860 |
| 2012 | $6,819 +3.7% | $165,860 |
| 2011 | $6,575 | $165,860 |
| 2010 | $6,575 +2.3% | $165,860 |
| 2009 | $6,425 +0.8% | $165,860 +16% |
| 2008 | $6,375 +5.1% | $143,010 +1.1% |
| 2007 | $6,068 +1.4% | $141,510 |
| 2006 | $5,983 +20% | $141,510 +56.7% |
| 2003 | $4,985 -15.1% | $90,300 |
| 2001 | $5,870 +58.7% | $90,300 +58.7% |
| 2000 | $3,698 0% | $56,896 0% |
| 1999 | $3,699 | $56,900 |
Find assessor info on the county website
Monthly payment
Est. payment
Payment breakdown
Explore the cost of this home by adjusting the details. Changes won't be saved.Climate risks
Neighborhood: Brooklawn/ St. Vincent's


Similar homes
- $599,0004 bd2 ba2.1k sqft416 Wells Street, Bridgeport, CT 06606For Sale
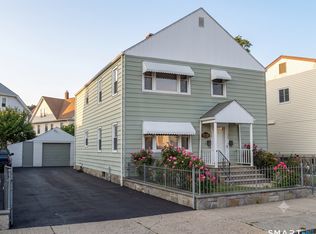
 MLS ID #24192097, Ian Ross, Mia Realty LLC. Smart MLS
- $650,0004 bd2 ba2.3k sqft45 Grasso Terrace, Bridgeport, CT 06604For Sale
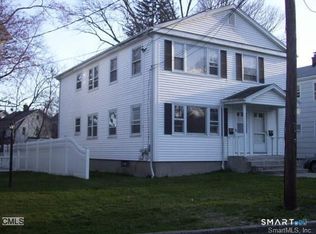 MLS ID #24196985, Helene Daly, Compass Connecticut, LLC. Smart MLS
- $585,0004 bd2 ba1.4k sqft1385 Chopsey Hill Road, Bridgeport, CT 06606For Sale
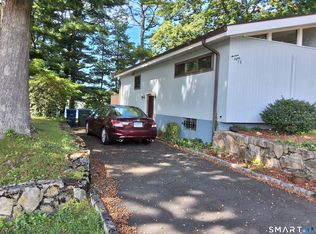 MLS ID #24211714, Jeffrey Tisdale, RE/MAX Right Choice. Smart MLS
- $499,9004 bd2 ba1.6k sqft22-24 Evers Court, Bridgeport, CT 06610For Sale
 MLS ID #24215561, Christopher Germosen, King Realty Group LLC. Smart MLS
- $689,0004 bd2 ba1.9k sqft4 Ascolese Road, Trumbull, CT 06611For SaleMLS ID #24196779, Ruth Miner, Country Club Properties. Smart MLS
- $679,9004 bd2 ba2k sqft465 James Farm Road, Stratford, CT 06614For SaleMLS ID #24213147, Lori Manigo, Manigo Realty Group. Smart MLS
- $430,0004 bd2 ba1.5k sqft1046 Sylvan Avenue, Bridgeport, CT 06606For SaleMLS ID #24213405, Moses A. Peter, KW Legacy Partners. Smart MLS
- $399,9973 bd2 ba1.6k sqft41 Quince Street, Bridgeport, CT 06606For SaleMLS ID #24195220, Rudy Pierre, YellowBrick Real Estate LLC. Smart MLS
- $515,0003 bd3 ba2.7k sqft368 Platt Street, Bridgeport, CT 06606For SaleMLS ID #24211664, Craig Ings, Hill Top Real Estate, LLC. Smart MLS
- $445,0003 bd2 ba2k sqft26 Marsdale Avenue, Bridgeport, CT 06606For SaleMLS ID #24191455, Colette J. Daye, Century 21 AllPoints Realty. Smart MLS
- $465,0003 bd2 ba1.5k sqft34 Harlem Avenue, Bridgeport, CT 06606For SaleMLS ID #24192375, Rosa E. Gallego, Five Stars Realty. Smart MLS
- $489,9994 bd2 ba1.2k sqft406 Lakeside Drive, Bridgeport, CT 06606For SaleMLS ID #24210959, Kenny Clyburn, BHGRE Shore & Country. Smart MLS
- $719,0004 bd3 ba2.3k sqft18 Maple Street, Trumbull, CT 06611For SaleMLS ID #24213771, Cristy A. Lu, YellowBrick Real Estate LLC. Smart MLS
- $689,0003 bd2 ba1.5k sqft265 Jackman Avenue, Fairfield, CT 06825For SaleMLS ID #24195557, Christopher Giolitto, William Raveis Real Estate. Smart MLS
- $699,9004 bd2 ba1.5k sqft2698 Easton Turnpike, Fairfield, CT 06825For SaleMLS ID #24173563, Hala Metwally, US Asset Realty. Smart MLS
- $649,0005 bd2 ba2.2k sqft430 Albert Avenue, Stratford, CT 06614For SaleMLS ID #24162070, Cornelius Howard, eXp Realty. Smart MLS
- $525,0006 bd2 ba2.5k sqft297 Laurel Avenue, Bridgeport, CT 06605For SaleMLS ID #24200850, Omar Ruizesparza, Maple Vale Realty LLC. Smart MLS
- $449,9003 bd2 ba2.2k sqft1645 Old Town Road, Bridgeport, CT 06606For SaleMLS ID #24188675, Carolyn Colon-Ortega, Century 21 Scala Group. Smart MLS
- $430,0004 bd1 ba1.1k sqft500 Woodlawn Ave Extension, Bridgeport, CT 06606For SaleMLS ID #24207670, Angel Mora, eXp Realty. Smart MLS
- $589,9004 bd2 ba1.9k sqft41 Burritt Avenue, Stratford, CT 06615For SaleMLS ID #24213461, Paul C. Plonsky, Realty ONE Group Connect. Smart MLS
