The seller does not accept blind offers or escalation clauses. Cash offers require 10% EMD. Financed offers require 1% EM or $1,000 minimum, whichever is greater. Home is sold in as is shape, seller and agent have no material knowledge on the condition of the home.
Active
Listed by: REO Solutions LLC • Bobby Mudd • 314-435-3819
$240,000
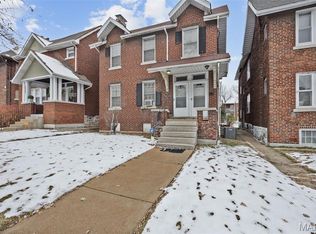
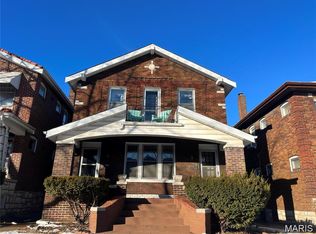
4983 Chippewa St, Saint Louis, MO 63109
--beds
--baths
2,560sqft
Multi Family
Built in 1926
-- sqft lot
$-- Zestimate®
$94/sqft
$-- HOA
What's special
- 25 days
- 215
- 24
Zillow last checked:
Listing updated:
Listed by:
Bobby Mudd 314-435-3819,
REO Solutions LLC
Source: MARIS,MLS#: 26067812 Originating MLS: St. Louis Association of REALTORS
Facts & features
Interior
Cooling
- Other
Features
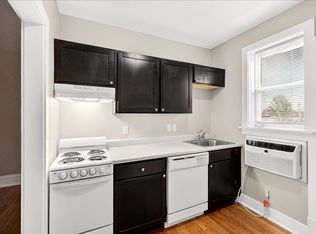
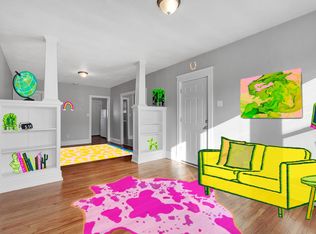
- Basement: Unfinished
- Has fireplace: No
Interior area
- Total structure area: 2,560
- Total interior livable area: 2,560 sqft
- Finished area above ground: 2,560
Property
Lot
- Size: 4,199 Square Feet
Details
- Parcel number: 60350001900
- Special conditions: Real Estate Owned
Construction
Type & style
- Home type: MultiFamily
- Architectural style: Other
- Property subtype: Multi Family
Materials
- Brick
Condition
- Year built: 1926
Community & HOA
Community
- Subdivision: Northampton
HOA
- Has HOA: No
Location
- Region: Saint Louis
Financial & listing details
- Price per square foot: $94/sqft
- Tax assessed value: $58,250
- Annual tax amount: $4,797
- Date on market: 10/21/2026
- Listing terms: Cash,Conventional
Foreclosure details
Estimated market value
Not available
Estimated sales range
Not available
Not available
Price history
| Date | Event | Price |
|---|---|---|
| 5/15/2026 | Sold | -- |
Source: Public Record Report a problem | ||
| 12/27/2025 | Listing removed | $300,000$117/sqft |
Source:  MARIS #25057268 Report a problem | ||
| 9/20/2025 | Price change | $300,000-3.2%$117/sqft |
Source: MARIS #25057268 Report a problem | ||
| 8/22/2025 | Listed for sale | $310,000-4.6%$121/sqft |
Source: MARIS #25057268 Report a problem | ||
| 7/31/2025 | Listing removed | $325,000$127/sqft |
Source: MARIS #25001349 Report a problem | ||
| 5/29/2025 | Price change | $325,000-6.9%$127/sqft |
Source: MARIS #25001349 Report a problem | ||
| 5/10/2025 | Listed for sale | $349,000$136/sqft |
Source: MARIS #25001349 Report a problem | ||
| 4/15/2025 | Contingent | $349,000$136/sqft |
Source: MARIS #25001349 Report a problem | ||
| 2/10/2025 | Price change | $349,000-4.4%$136/sqft |
Source: MARIS #25001349 Report a problem | ||
| 1/13/2025 | Listed for sale | $365,000+21.7%$143/sqft |
Source: MARIS #25001349 Report a problem | ||
| 9/23/2022 | Sold | -- |
Source: MARIS #22052949 Report a problem | ||
| 8/23/2022 | Pending sale | $300,000$117/sqft |
Source: MARIS #22052949 Report a problem | ||
| 8/17/2022 | Listed for sale | $300,000+721.9%$117/sqft |
Source: MARIS #22052949 Report a problem | ||
| 12/13/2012 | Sold | -- |
Source: MARIS #12058670 Report a problem | ||
| 10/6/2012 | Listed for sale | $36,500$14/sqft |
Source: foreclosure.com Report a problem | ||
| 12/29/2011 | Sold | -- |
Source: Public Record Report a problem | ||
Public tax history
| Year | Property taxes | Tax assessment |
|---|---|---|
| 2025 | $4,797 +16.2% | $58,250 +18.9% |
| 2024 | $4,128 +5.1% | $48,980 |
| 2023 | $3,926 +9.8% | $48,980 +14.1% |
| 2022 | $3,577 +0.1% | $42,940 |
| 2021 | $3,572 +8.6% | $42,940 +7.5% |
| 2020 | $3,289 | $39,960 |
| 2019 | $3,289 | $39,960 +19.8% |
| 2018 | $3,289 +16% | $33,350 |
| 2017 | $2,836 +37.9% | $33,350 +37.8% |
| 2016 | $2,057 +10.3% | $24,210 |
| 2015 | $1,865 +236% | $24,210 |
| 2014 | $555 | $24,210 +248.3% |
| 2013 | $555 | $6,950 -75% |
| 2012 | -- | $27,780 |
| 2011 | -- | $27,780 |
| 2010 | -- | $27,780 -1.5% |
| 2009 | $1,903 +28.5% | $28,210 |
| 2008 | $1,481 | $28,210 +13% |
| 2007 | $1,481 | $24,970 |
| 2006 | $1,481 +12% | $24,970 +20.2% |
| 2005 | $1,322 +45.8% | $20,780 +72.7% |
| 2004 | $906 +2.9% | $12,030 |
| 2003 | $881 +9.4% | $12,030 +12.4% |
| 2002 | $805 | $10,700 |
| 2001 | -- | $10,700 +2.4% |
| 2000 | -- | $10,450 |
Find assessor info on the county website
Monthly payment
Climate risks
Neighborhood: North Hampton
Nearby schools
Schools provided by the listing agent
- Elementary: Buder Elem.
- Middle: Long Middle Community Ed. Center
- High: Roosevelt High
Source: MARIS. This data may not be complete. We recommend contacting the local school district to confirm school assignments for this home.

Similar homes
- $225,0004 bd2 ba2.2k sqft3638 Marceline Ter, Saint Louis, MO 63116For Sale
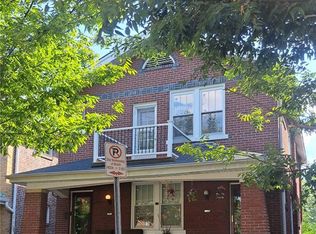
 MLS ID #26057038, Angela M Happle, Wood Brothers Realty. MARIS
- $315,0002 bd1 ba1.9k sqft5049 Lindenwood Ave, Saint Louis, MO 63109For Sale
 MLS ID #26065766, Joe Geary, Nettwork Global. MARIS
- $285,0004 bd2 ba2k sqft4977 Quincy St, Saint Louis, MO 63109For Sale
 MLS ID #26055885, Tammy K Derrigan, Worth Clark Realty. MARIS
- $249,9004 bd2 ba2.1k sqft3537 Minnesota Ave, Saint Louis, MO 63118For Sale
 MLS ID #26064670, Yuliana A Erazo Hidalgo, Real Broker LLC. MARIS
- $325,0004 bd4 ba2.8k sqft5026-5028 Chippewa St, Saint Louis, MO 63109For SaleMLS ID #25055468, David L Haley, Berkshire Hathaway HomeServices Select Properties. MARIS
- $250,0005 bd2 ba2.7k sqft4228 Virginia Ave, Saint Louis, MO 63111For SaleMLS ID #26041219, Christopher M Thiemet, RedKey Realty Leaders Circa. MARIS
- $249,9004 bd4 ba3.4k sqft3415 Dunnica Ave, Saint Louis, MO 63118For SaleMLS ID #26064226, Alex A Adank, Intersection Real Estate. MARIS
- $225,0007 bd4 ba2.1k sqft5880 Kennerly Ave #A, Saint Louis, MO 63112For SaleMLS ID #26058639, Tara L Herron, Legacy Realty & Associates, LLC. MARIS
- $270,0004 bd2 ba2.3k sqft3929 Pennsylvania Ave, Saint Louis, MO 63118For SaleMLS ID #26068225, Rodney Wallner, Berkshire Hathaway HomeServices Select Properties. MARIS
- $299,0003 bd3 ba1.9k sqft4910 Bonita Ave, Saint Louis, MO 63109For SaleMLS ID #26056443, Christy Andrews, Garcia Properties. MARIS
- $199,9004 bd4 ba2.7k sqft4617 S Broadway, Saint Louis, MO 63111For SaleMLS ID #26064777, Brian C Miller, Mogul Realty. MARIS
- $259,9002 bd2 ba1.7k sqft3924 Miami St, Saint Louis, MO 63116For SaleMLS ID #26043844, Anna Kozak, Berkshire Hathaway HomeServices Select Properties. MARIS
- $269,9004 bd4 ba3.6k sqft5516 S Grand Blvd, Saint Louis, MO 63111For SaleMLS ID #26047216, Brian C Miller, Mogul Realty. MARIS
- $240,0003 bd2 ba1.5k sqft1516 Salisbury St, Saint Louis, MO 63107For SaleMLS ID #26070370, Beatrice C Covington, Emmanuel Jamar Realty Group. MARIS
- $240,0003 bd2 ba1.5k sqft1518 Salisbury St, Saint Louis, MO 63107For SaleMLS ID #26070357, Beatrice C Covington, Emmanuel Jamar Realty Group. MARIS
- $240,0003 bd2 ba1.5k sqft1514 Salisbury St, Saint Louis, MO 63107For SaleMLS ID #26070379, Beatrice C Covington, Emmanuel Jamar Realty Group. MARIS
- $245,0001 bd1 ba3.1k sqft3853 Potomac St, Saint Louis, MO 63116For SaleMLS ID #26007320, Kenin G Halilovic, CBRE. MARIS
- $225,0004 bd3 ba1.7k sqft3104 Wyoming St, Saint Louis, MO 63118For SaleMLS ID #26055829, Tammy K Derrigan, Worth Clark Realty. MARIS
- $230,0003 bd1 ba1.4k sqft3560 S Spring Ave, Saint Louis, MO 63116For SaleMLS ID #26061122, Stacey D Spruiel, Premier Spaces Real Estate. MARIS
- $260,0006 bd2 ba2.8k sqft3646 Shenandoah Ave, Saint Louis, MO 63110For SaleMLS ID #26060668, Agnes Agbo, Platinum Realty of St. Louis. MARIS
