$155,700
4 bd|2 ba|1.3k sqft
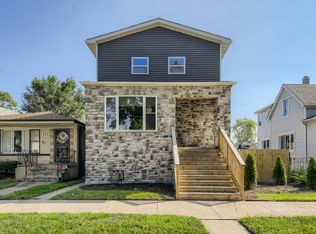
521 E 89th Pl, Chicago, IL 60619
Off Market
Zillow last checked:
Sherman Tidwell (773)818-9675,
eXp Realty
Not available
Estimated sales range
Not available
Not available
| Date | Event | Price |
|---|---|---|
| 6/27/2026 | Listed for sale | $285,900-1.3%$116/sqft |
Source: eXp Realty #12690073 Report a problem | ||
| 1/17/2026 | Listing removed | $289,800$117/sqft |
Source: eXp Realty #12482979 Report a problem | ||
| 12/22/2025 | Price change | $289,800-0.7%$117/sqft |
Source: | ||
| 12/2/2025 | Price change | $291,800-0.6%$118/sqft |
Source: | ||
| 11/4/2025 | Price change | $293,700-0.7%$119/sqft |
Source: | ||
| 10/14/2025 | Price change | $295,700-0.7%$119/sqft |
Source: | ||
| 9/29/2025 | Listed for sale | $297,700-0.8%$120/sqft |
Source: | ||
| 9/15/2025 | Listing removed | $299,999$121/sqft |
Source: | ||
| 5/9/2025 | Listed for sale | $299,999$121/sqft |
Source: | ||
| 4/4/2025 | Listing removed | $299,999$121/sqft |
Source: | ||
| 3/31/2025 | Listed for sale | $299,999$121/sqft |
Source: | ||
| 3/26/2025 | Pending sale | $299,999$121/sqft |
Source: | ||
| 3/9/2025 | Listed for sale | $299,999-2.1%$121/sqft |
Source: | ||
| 3/6/2025 | Listing removed | $306,550$124/sqft |
Source: | ||
| 12/12/2024 | Listed for sale | $306,550-1.3%$124/sqft |
Source: | ||
| 10/28/2024 | Listing removed | $310,550$125/sqft |
Source: | ||
| 10/22/2024 | Price change | $310,550-1.6%$125/sqft |
Source: | ||
| 9/3/2024 | Listed for sale | $315,550-6%$127/sqft |
Source: | ||
| 8/19/2024 | Listing removed | $335,550$136/sqft |
Source: | ||
| 8/13/2024 | Price change | $335,550-2.9%$136/sqft |
Source: | ||
| 8/1/2024 | Listed for sale | $345,550+4.7%$140/sqft |
Source: | ||
| 3/4/2023 | Listing removed | -- |
Source: | ||
| 11/23/2022 | Price change | $329,900-2.9%$133/sqft |
Source: | ||
| 11/3/2022 | Listed for sale | $339,900$137/sqft |
Source: | ||
| Year | Property taxes | Tax assessment |
|---|---|---|
| 2024 | -- | $15,501 +138.5% |
| 2023 | $672 +6.1% | $6,499 |
| 2022 | $633 -0.6% | $6,499 |
| 2021 | $637 -78.9% | $6,499 -61% |
| 2020 | $3,018 -0.3% | $16,651 -10% |
| 2019 | $3,028 +1.8% | $18,502 |
| 2018 | $2,976 -6.5% | $18,502 +1.9% |
| 2017 | $3,181 +1.5% | $18,154 |
| 2016 | $3,136 +10.2% | $18,154 |
| 2015 | $2,846 -0.8% | $18,154 +0.7% |
| 2014 | $2,869 +2.4% | $18,034 |
| 2013 | $2,802 +0.5% | $18,034 |
| 2012 | $2,788 +7.5% | $18,034 -10% |
| 2011 | $2,593 +4.9% | $20,044 |
| 2010 | $2,473 +12.4% | $20,044 |
| 2009 | $2,200 +1.4% | $20,044 -8.2% |
| 2008 | $2,169 +20.3% | $21,837 |
| 2007 | $1,803 +5.9% | $21,837 |
| 2006 | $1,702 -5.1% | $21,837 +35.7% |
| 2005 | $1,794 +1.9% | $16,095 |
| 2004 | $1,761 +4.5% | $16,095 |
| 2003 | $1,686 -5.4% | $16,095 +37.1% |
| 2002 | $1,782 +5.9% | $11,741 |
| 2001 | $1,683 +123.4% | $11,741 |
| 2000 | $753 | $11,741 +98.3% |
| 1999 | -- | $5,921 |
Find assessor info on the county website
Source: MRED as distributed by MLS GRID. This data may not be complete. We recommend contacting the local school district to confirm school assignments for this home.
A local agent can set up tours, give advice and negotiate with sellers.