Great Location Near Schools, shopping, expressways. Updated Electrical. Three Bedrooms And Eat-In Kitchen. Newer Garage Has Room For 2 Cars and plenty of storage. Great ranch style home in a quiet neighborhood.
For sale
Price cut: $14.9K (10/3)
$155,000
5489 Avis Dr, Burton, MI 48519
3beds
864sqft
Single Family Residence
Built in 1964
0.27 Acres Lot
$152,600 Zestimate®
$179/sqft
$-- HOA
What's special
- 55 days
- 349
- 30
Zillow last checked:
Listing updated:
Listed by:
Elizabeth Waters-Scott 248-941-4152,
Real Estate For A CAUSE 810-344-7275
Source: Realcomp II,MLS#: 20261077222
Facts & features
Interior
Bedrooms & bathrooms
- Bedrooms: 3
- Bathrooms: 1
- Full bathrooms: 1
Bedroom
- Level: Entry
- Area: 156
- Dimensions: 12 X 13
Bedroom
- Level: Entry
- Area: 90
- Dimensions: 10 X 9
Bedroom
- Level: Entry
- Area: 90
- Dimensions: 10 X 9
Other
- Level: Entry
- Area: 55
- Dimensions: 11 X 5
Heating
- Forced Air, Natural Gas
Features
- Has basement: No
- Has fireplace: No
Interior area
- Total interior livable area: 864 sqft
- Finished area above ground: 864
Video & virtual tour
Property
Parking
- Total spaces: 2
- Parking features: Two Car Garage, Detached, Driveway, Electricityin Garage, Garage Faces Front, Garage Door Opener
- Garage spaces: 2
Features
- Levels: One
- Stories: 1
- Entry location: GroundLevelwSteps
- Pool features: None
Lot
- Size: 0.27 Acres
- Dimensions: 50 x 125
Details
- Parcel number: 5923526003
- Special conditions: Short Sale No,Standard
Construction
Type & style
- Home type: SingleFamily
- Architectural style: Ranch
- Property subtype: Single Family Residence
Materials
- Vinyl Siding
- Foundation: Crawl Space
Condition
- New construction: No
- Year built: 1964
- Major remodel year: 2020
Utilities & green energy
- Sewer: Public Sewer
- Water: Public
Community & HOA
Community
- Subdivision: ALICE GARDENS
HOA
- Has HOA: No
Location
- Region: Burton
Financial & listing details
- Price per square foot: $179/sqft
- Tax assessed value: $31,852
- Annual tax amount: $1,899
- Date on market: 9/23/2026
- Cumulative days on market: 55 days
- Listing agreement: Exclusive Right To Sell
- Listing terms: Cash,Conventional,FHA,Va Loan
- Exclusions: Exclusion(s) Do Not Exist
Estimated market value
$152,600
$145,000 - $160,000
$1,342/mo
Price history
| Date | Event | Price |
|---|---|---|
| 10/3/2026 | Price change | $155,000-8.8%$179/sqft |
Source:  Realcomp II #20261077222 Report a problem | ||
| 9/24/2026 | Listed for sale | $169,900+41.6%$197/sqft |
Source: Realcomp II #20261077222 Report a problem | ||
| 6/14/2021 | Listing removed | -- |
Source: Realcomp II #2210023989 Report a problem | ||
| 6/7/2021 | Price change | $120,000+20%$139/sqft |
Source: Realcomp II #2210023989 Report a problem | ||
| 4/12/2021 | Pending sale | $100,000$116/sqft |
Source: Realcomp II #2210023989 Report a problem | ||
| 4/10/2021 | Listed for sale | $100,000+42.9%$116/sqft |
Source: Realcomp II #2210023989 Report a problem | ||
| 1/25/2018 | Sold | $70,000-4%$81/sqft |
Source:  MiRealSource #21385117 Report a problem | ||
| 12/28/2017 | Pending sale | $72,900$84/sqft |
Source: Keller Williams Realty #30071041 Report a problem | ||
| 11/30/2017 | Price change | $72,900-2.7%$84/sqft |
Source: Keller Williams Realty #30071041 Report a problem | ||
| 11/2/2017 | Listed for sale | $74,900+24.8%$87/sqft |
Source: Keller Williams Realty #30071041 Report a problem | ||
| 10/5/2016 | Sold | $60,000-7.7%$69/sqft |
Source: MiRealSource #21147348 Report a problem | ||
| 6/22/2016 | Price change | $65,000-4.4%$75/sqft |
Source: Red Carpet Keim Action Group 1 #30058133 Report a problem | ||
| 6/19/2016 | Price change | $68,000-0.7%$79/sqft |
Source: Red Carpet Keim Action Group 1 #30058133 Report a problem | ||
| 6/15/2016 | Price change | $68,500-0.6%$79/sqft |
Source: Red Carpet Keim Action Group 1 #30058133 Report a problem | ||
| 6/13/2016 | Price change | $68,900-5.5%$80/sqft |
Source: Red Carpet Keim Action Group 1 #30058133 Report a problem | ||
| 6/11/2016 | Price change | $72,900-2.7%$84/sqft |
Source: Red Carpet Keim Action Group 1 #30058133 Report a problem | ||
| 6/8/2016 | Price change | $74,900-6.3%$87/sqft |
Source: Red Carpet Keim Action Group 1 #30058133 Report a problem | ||
| 5/15/2016 | Listed for sale | $79,900+271.6%$92/sqft |
Source: Red Carpet Keim Action Group 1 #30058133 Report a problem | ||
| 6/2/2010 | Sold | $21,500+7.5%$25/sqft |
Source: MiRealSource #20116703 Report a problem | ||
| 4/2/2010 | Listed for sale | $20,000-78.7%$23/sqft |
Source: foreclosure.com Report a problem | ||
| 10/28/2009 | Sold | $93,888+14.5%$109/sqft |
Source: Public Record Report a problem | ||
| 2/23/2007 | Sold | $82,000+115.8%$95/sqft |
Source: Public Record Report a problem | ||
| 4/20/2006 | Sold | $38,000-47.9%$44/sqft |
Source: Public Record Report a problem | ||
| 1/20/2005 | Sold | $72,900$84/sqft |
Source: Public Record Report a problem | ||
Public tax history
| Year | Property taxes | Tax assessment |
|---|---|---|
| 2025 | $1,562 +7.8% | $59,900 +12.2% |
| 2024 | $1,449 | $53,400 +30.2% |
| 2023 | -- | $41,000 -4.7% |
| 2022 | -- | $43,000 +51.9% |
| 2021 | -- | $28,300 -7.5% |
| 2020 | -- | $30,600 +17.7% |
| 2019 | -- | $26,000 +12.6% |
| 2018 | $1,167 -24.8% | $23,100 |
| 2017 | $1,552 +3.8% | $23,100 -0.4% |
| 2016 | $1,496 | $23,200 |
| 2015 | $1,496 | -- |
| 2012 | -- | $19,800 -7.9% |
| 2011 | -- | $21,500 -7.7% |
| 2010 | -- | $23,300 -33.6% |
| 2008 | $207 | $35,100 -8.6% |
| 2006 | -- | $38,400 +9.7% |
| 2005 | -- | $35,000 +6.1% |
| 2004 | -- | $33,000 +1.2% |
| 2003 | -- | $32,600 -16% |
| 2002 | $948 +23.4% | $38,800 +15.1% |
| 2001 | $768 +3.8% | $33,700 +6.6% |
| 2000 | $740 | $31,600 |
Find assessor info on the county website
Monthly payment
Est. payment
Payment breakdown
Explore the cost of this home by adjusting the details. Changes won't be saved.Climate risks
Neighborhood: 48519
Similar homes
- $155,9002 bd1 ba1.1k sqft5073 E Atherton Rd, Burton, MI 48519For Sale
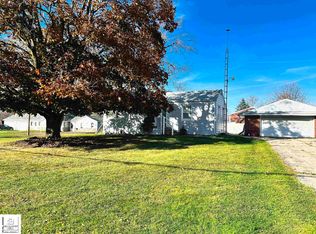
 MLS ID #50227514, Cindy M Zdenek, Red Carpet Keim Action Group 1. MiRealSource
- $155,0002 bd1 ba864 sqft2115 Sandalwood Dr, Burton, MI 48519For Sale

 MLS ID #20261085870, Annette Monette, Coldwell Banker Town & Country. Realcomp II
- $174,9002 bd1 ba720 sqft6214 E Bristol Rd, Burton, MI 48519For Sale
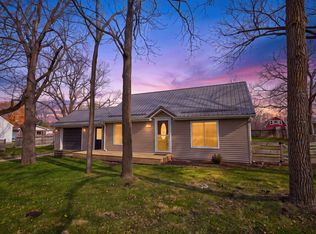 MLS ID #50227359, Rebeca Anderson Garty, Keller Williams First. MiRealSource
- $--2 bd1 ba1k sqft2431 Howe Rd, Burton, MI 48519Auction
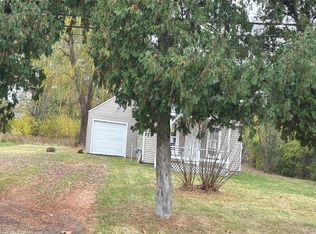 Auction.com 2
- $155,0002 bd2 ba820 sqft3244 S Center Rd, Burton, MI 48519For SaleMLS ID #50223494, Genevieve Medina, Century 21 Signature Realty. MiRealSource
- $164,9003 bd2 ba1k sqft1398 Merle Ave, Burton, MI 48509For SaleMLS ID #20261074509, Nykole Pfaff, The Brokerage Real Estate Enthusiasts. Realcomp II
- $145,0003 bd1 ba864 sqft1400 S Packard Ave, Burton, MI 48509For SaleMLS ID #50226213, Ken Lipowski, RE/MAX First. MiRealSource
- $165,0003 bd1 ba1.1k sqft4441 E Court St, Burton, MI 48509For SaleMLS ID #20261079663, Dylan Schumacher, The Brand Real Estate. Realcomp II
- $125,0003 bd1 ba1.1k sqft6106 E Bristol Rd, Burton, MI 48519For SaleMLS ID #50226639, Katie M Hartline, REMAX Edge. MiRealSource
- $162,0003 bd1 ba1.2k sqft1198 Brabbs St, Burton, MI 48509For SaleMLS ID #20261065640, Tina Aginaga, Keller Williams Premier. Realcomp II
- $125,0003 bd1 ba1k sqft2088 Sandalwood Dr, Burton, MI 48519For SaleMLS ID #20261083095, Renah Jasser, Real Estate For A CAUSE. Realcomp II
- $154,9003 bd1 ba823 sqft2043 Hillsdale Dr, Davison, MI 48423For SaleMLS ID #20261064346, Carol A Van Dyke Dietrich, Oak and Stone Real Estate. Realcomp II
- $179,9003 bd1 ba1.1k sqft2060 Christner St, Burton, MI 48519For SaleMLS ID #20261057928, Dominic Sirignano, Atlas Real Estate. Realcomp II
- $120,0002 bd1 ba720 sqft5325 Sitka St, Burton, MI 48519For SaleMLS ID #20261080893, Jennifer Spiers, Great Lakes Team Realty. Realcomp II
- $189,0003 bd1 ba947 sqft3041 Clayward Dr, Flint, MI 48506For SaleMLS ID #20261092251, Gjon Gjonaj, American Associates Inc. Realcomp II
- $114,9003 bd1 ba1.2k sqft4150 S Center Rd, Burton, MI 48519For SaleMLS ID #20261086345, Miguel Perez, Keller Williams First. Realcomp II
- $139,9003 bd1 ba1.1k sqft5118 Berneda Dr, Flint, MI 48506For SaleMLS ID #20261073078, Tamira Newman, The Agency of Gateway. Realcomp II
- $129,9994 bd2 ba1.2k sqft2222 Savoy Ave, Burton, MI 48529For SaleMLS ID #50227565, Dane Seltzer, Dane Seltzer Real Estate Group. MiRealSource
