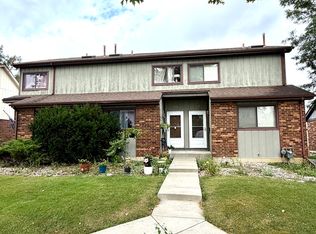
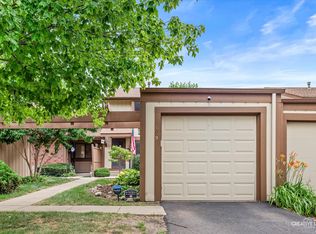
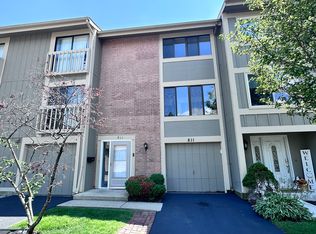
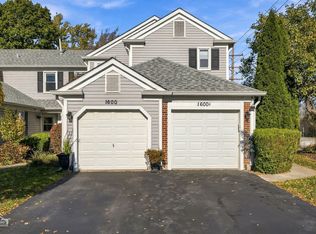
$237,800
2 bd1 ba936 sqft
561 Forum Dr, Roselle, IL 60172
Off Market

Listing description withheld by the listing agent.
Likely to sell faster than
Zillow last checked:
Listing updated:
Kapil Aggarwal 312-752-5460,
American Homes Real Estate Corp.

Not available
Estimated sales range
Not available
Not available
| Date | Event | Price |
|---|---|---|
| 1/20/2022 | Sold | $205,000-2.4%$141/sqft |
Source:  MRED as distributed by MLS GRID #11280938 Report a problem | ||
| 12/14/2021 | Contingent | $210,000$144/sqft |
Source: MRED as distributed by MLS GRID #11280938 Report a problem | ||
| 12/3/2021 | Listed for sale | $210,000+16.7%$144/sqft |
Source: MRED as distributed by MLS GRID #11280938 Report a problem | ||
| 7/4/2019 | Listing removed | $179,899$124/sqft |
Source: Coldwell Banker Residential Brokerage - Schaumburg #10130060 Report a problem | ||
| 5/8/2019 | Price change | $179,899-3%$124/sqft |
Source: Coldwell Banker Residential Brokerage - Schaumburg #10130060 Report a problem | ||
| 5/1/2019 | Listed for sale | $185,500$127/sqft |
Source: Coldwell Banker Residential Brokerage - Schaumburg #10130060 Report a problem | ||
| 4/25/2019 | Pending sale | $185,500$127/sqft |
Source: Coldwell Banker Residential Brokerage - Schaumburg #10130060 Report a problem | ||
| 4/22/2019 | Listed for sale | $185,500$127/sqft |
Source: Coldwell Banker Residential Brokerage - Schaumburg #10130060 Report a problem | ||
| 4/3/2019 | Pending sale | $185,500$127/sqft |
Source: Coldwell Banker Residential Brokerage - Schaumburg #10130060 Report a problem | ||
| 11/5/2018 | Listed for sale | $185,500+24.5%$127/sqft |
Source: Coldwell Banker Residential Brokerage #10130060 Report a problem | ||
| 9/3/2009 | Sold | $149,000-3.8%$102/sqft |
Source: Public Record Report a problem | ||
| 4/17/2009 | Listing removed | $154,913$106/sqft |
Source: ERA #07129137 Report a problem | ||
| 3/1/2009 | Price change | $154,913-3.1%$106/sqft |
Source: ERA #07129137 Report a problem | ||
| 2/14/2009 | Listed for sale | $159,913+39.1%$110/sqft |
Source: ERA #07129137 Report a problem | ||
| 5/28/1998 | Sold | $115,000$79/sqft |
Source: Public Record Report a problem | ||
| Year | Property taxes | Tax assessment |
|---|---|---|
| 2025 | $4,482 +6.4% | $80,862 +9.3% |
| 2024 | $4,214 +8.8% | $73,975 +9.3% |
| 2023 | $3,873 +10.4% | $67,650 +13.1% |
| 2022 | $3,506 +5.3% | $59,790 +5.2% |
| 2021 | $3,331 -0.9% | $56,810 +2.5% |
| 2020 | $3,362 +3.8% | $55,420 +4.1% |
| 2019 | $3,239 +21.6% | $53,250 +21% |
| 2018 | $2,663 +5.9% | $44,000 +7.9% |
| 2017 | $2,515 +4.5% | $40,780 +8.1% |
| 2016 | $2,406 +2.6% | $37,740 +7.2% |
| 2015 | $2,344 +0.9% | $35,210 +4.1% |
| 2014 | $2,322 +0.7% | $33,830 -3.3% |
| 2013 | $2,305 -26.6% | $34,990 -29.8% |
| 2012 | $3,142 +2.3% | $49,820 -9.4% |
| 2011 | $3,070 +0.3% | $55,010 -7.3% |
| 2010 | $3,062 +2.3% | $59,310 -6.9% |
| 2009 | $2,993 +0.9% | $63,690 |
| 2008 | $2,965 +4.3% | $63,690 +5.3% |
| 2007 | $2,842 +3.3% | $60,480 +6% |
| 2006 | $2,751 +5% | $57,040 +6.6% |
| 2005 | $2,619 +4.9% | $53,510 +6.8% |
| 2004 | $2,497 +1% | $50,100 +10% |
| 2003 | $2,471 +7.6% | $45,540 +9.3% |
| 2002 | $2,297 +5.4% | $41,650 +9.1% |
| 2001 | $2,180 +2.9% | $38,190 +4.9% |
| 2000 | $2,118 | $36,410 |
Source: MRED as distributed by MLS GRID. This data may not be complete. We recommend contacting the local school district to confirm school assignments for this home.

A local agent can set up tours, give advice and negotiate with sellers.