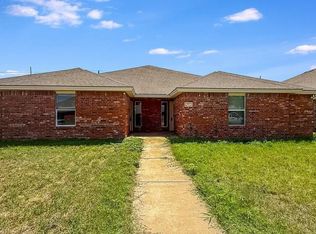
Duplex for sale in NW Lubbock. This property offers two units, each a 3/3/2 and central heating and air. Schedule your showing today! Unit A is leased until 6/30/2027 and Unit B is leased until 3/31/2027
For sale
$258,000
606 N Bangor Ave, Lubbock, TX 79416
6beds
2,732sqft
Duplex, Multi Family
Built in 2004
-- sqft lot
$248,900 Zestimate®
$94/sqft
$-- HOA
What's special
Central heating and air
- 4 days
- 93
- 9
Likely to sell faster than
Zillow last checked:
Listing updated:
Listed by:
Casey Klingensmith TREC #0633729 940-328-3123,
Reside Real Estate Co.
Source: LBMLS,MLS#: 202614150
Facts & features
Interior
Bedrooms & bathrooms
- Bedrooms: 6
- Bathrooms: 6
- Full bathrooms: 6
Heating
- Central
Cooling
- Ceiling Fan(s), Central Air
Features
- Has basement: No
Interior area
- Total structure area: 2,732
- Total interior livable area: 2,732 sqft
- Finished area above ground: 2,732
Property
Parking
- Total spaces: 4
- Parking features: Attached, Garage
- Attached garage spaces: 4
Features
- Fencing: Back Yard
Lot
- Size: 7,840 Square Feet
Details
- Parcel number: R303497
Construction
Type & style
- Home type: MultiFamily
- Architectural style: Traditional
- Property subtype: Duplex, Multi Family
Materials
- Brick Veneer
- Foundation: Slab
- Roof: Composition
Condition
- New construction: No
- Year built: 2004
Community & HOA
Community
- Security: See Remarks
Location
- Region: Lubbock
Financial & listing details
- Price per square foot: $94/sqft
- Tax assessed value: $248,636
- Annual tax amount: $4,399
- Date on market: 10/14/2026
- Listing terms: Cash,Conventional
- Tenant pays: All Utilities
- Road surface type: Alley Paved
Estimated market value
$248,900
$236,000 - $261,000
$1,274/mo
Price history
| Date | Event | Price |
|---|---|---|
| 10/14/2026 | Listed for sale | $258,000$94/sqft |
Source:  LBMLS #202614150 Report a problem | ||
| 8/20/2015 | Sold | -- |
Source: Public Record Report a problem | ||
Public tax history
| Year | Property taxes | Tax assessment |
|---|---|---|
| 2025 | $4,399 -2.6% | $248,636 -4.7% |
| 2024 | $4,515 -1% | $260,913 +0.2% |
| 2023 | $4,561 +3.4% | $260,519 +14% |
| 2022 | $4,410 +14.8% | $228,465 +26.5% |
| 2021 | $3,840 -1.8% | $180,545 -1.1% |
| 2020 | $3,909 -3.6% | $182,509 -2.1% |
| 2019 | $4,054 +13.8% | $186,435 +18.9% |
| 2018 | $3,561 | $156,811 -1% |
| 2017 | $3,561 +14.4% | $158,431 -1% |
| 2016 | $3,114 | $159,994 +14.2% |
| 2014 | $3,114 | $140,039 -1.8% |
| 2013 | -- | $142,673 -0.9% |
| 2012 | -- | $143,990 |
| 2011 | -- | $143,990 -0.9% |
| 2010 | -- | $145,307 -0.9% |
| 2009 | -- | $146,625 -2.6% |
| 2008 | -- | $150,576 -3.1% |
| 2007 | -- | $155,315 |
| 2006 | -- | $155,315 -0.6% |
| 2005 | -- | $156,315 |
Find assessor info on the county website
Monthly payment
Est. payment
Payment breakdown
Explore the cost of this home by adjusting the details. Changes won't be saved.Climate risks
Neighborhood: North By Northwest


Similar homes
- $259,0006 bd6 ba2.7k sqft906 N Bangor Ave, Lubbock, TX 79416For Sale
 MLS ID #202605358, Cole Whisenhunt, Keller Williams Realty. LBMLS
- $255,0006 bd6 ba2.7k sqft912 N Bangor Ave, Lubbock, TX 79416For Sale
 MLS ID #202609470, LaDonna Sanchez, United Realty, LLC. LBMLS
- $370,0006 bd6 ba2.8k sqft5502 Itasca St, Lubbock, TX 79416For Sale
 MLS ID #202614098, Michael Norsworthy, eXp Realty LLC. LBMLS
- $370,0006 bd6 ba2.8k sqft5523 Itasca St, Lubbock, TX 79416For Sale
 MLS ID #202614099, Michael Norsworthy, eXp Realty LLC. LBMLS
