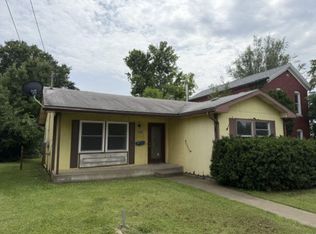
Investment opportunity with income potential! Priced at just $80,000, this turnkey 2-unit multifamily property offers an excellent opportunity to build equity while generating rental income! Each unit features 2 bedrooms and 1 full bathroom, with one unit located on the main floor and the other upstairs. Rents are set at $800 and $850 per month, offering a combined potential rental income of $1,650 per month ($19,800 annually). The back half of the roof was replaced in June 2026. Affordable price, strong income potential, and a great opportunity to expand your investment portfolio!
For sale
Price cut: $5.2K (11/11)
$74,800
613 N 8th St, Quincy, IL 62301
4beds
2baths
1,690sqft
Multi Family
Built in 1920
-- sqft lot
$-- Zestimate®
$44/sqft
$-- HOA
What's special
- 35 days
- 284
- 22
Zillow last checked:
Listing updated:
Listed by:
Jacquelyn Weisenburger Office:217-224-8383,
Happel, Inc., REALTORS
Source: RMLS Alliance as distributed by MLS GRID,MLS#: CA1047183 Originating MLS: Capital Area Association of Realtors
Facts & features
Interior
Bedrooms & bathrooms
- Bedrooms: 4
- Bathrooms: 2
Heating
- Electric
Appliances
- Included: Range, Refrigerator, Water Heater
Features
- Basement: Partial
Interior area
- Total structure area: 1,690
- Total interior livable area: 1,690 sqft
Property
Parking
- Total spaces: 2
- Parking features: On Street
- Has uncovered spaces: Yes
Lot
- Size: 3,484 Square Feet
- Dimensions: 23 x 152
- Features: Level
Details
- Parcel number: 235058500000
Construction
Type & style
- Home type: MultiFamily
- Property subtype: Multi Family
Materials
- Brick
- Roof: Shingle
Condition
- New construction: No
- Year built: 1920
Utilities & green energy
- Sewer: Public Sewer
- Water: Public
Community & HOA
Community
- Subdivision: None
Location
- Region: Quincy
Financial & listing details
- Price per square foot: $44/sqft
- Tax assessed value: $40,320
- Annual tax amount: $878
- Date on market: 10/16/2026
- Cumulative days on market: 37 days
Estimated market value
Not available
Estimated sales range
Not available
Not available
Price history
| Date | Event | Price |
|---|---|---|
| 11/11/2026 | Price change | $74,800-6.5%$44/sqft |
Source:  RMLS Alliance as distributed by MLS GRID #CA1047183 Report a problem | ||
| 10/16/2026 | Listed for sale | $80,000+33.6%$47/sqft |
Source: RMLS Alliance as distributed by MLS GRID #CA1047183 Report a problem | ||
| 7/27/2024 | Listing removed | -- |
Source: Zillow Rentals Report a problem | ||
| 7/23/2024 | Listed for rent | $700+7.7% |
Source: Zillow Rentals Report a problem | ||
| 8/3/2023 | Listing removed | -- |
Source: Zillow Rentals Report a problem | ||
| 7/21/2023 | Listed for rent | $650 |
Source: Zillow Rentals Report a problem | ||
| 4/15/2023 | Listing removed | -- |
Source: RMLS Alliance as distributed by MLS GRID #QC4239937 Report a problem | ||
| 2/21/2023 | Price change | $59,900-7.7%$35/sqft |
Source:  Quincy AOR #202600 Report a problem | ||
| 1/20/2023 | Listed for sale | $64,900+260.6%$38/sqft |
Source: Quincy AOR #202600 Report a problem | ||
| 11/30/2012 | Sold | $18,000$11/sqft |
Source:  MRED as distributed by MLS GRID #12244586 Report a problem | ||
Public tax history
| Year | Property taxes | Tax assessment |
|---|---|---|
| 2025 | $878 +6.2% | $13,440 +6% |
| 2024 | $827 +123.6% | $12,680 +126.8% |
| 2023 | $370 +5.7% | $5,590 +7.1% |
| 2022 | $350 -0.7% | $5,220 +2.2% |
| 2021 | $352 +1.9% | $5,110 +2% |
| 2020 | $345 +36.9% | $5,010 +35.8% |
| 2019 | $252 +0.7% | $3,690 +1.9% |
| 2018 | $250 +2.7% | $3,620 +1.1% |
| 2017 | $244 +1.9% | $3,580 +4.1% |
| 2016 | $239 -100% | $3,440 |
| 2015 | $23,038,000 +5660342% | $3,440 -41.4% |
| 2012 | $407 | $5,870 |
| 2011 | $407 +8.3% | $5,870 +6.5% |
| 2009 | $376 +4.5% | $5,510 |
| 2008 | $360 +31.7% | $5,510 +5.2% |
| 2007 | $273 | $5,240 |
Find assessor info on the county website
Monthly payment
Est. payment
Payment breakdown
Explore the cost of this home by adjusting the details. Changes won't be saved.Climate risks
Neighborhood: 62301
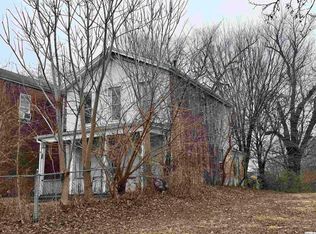
Similar homes
- $77,9003 bd1 ba1.3k sqft1219 Lind St, Quincy, IL 62301For Sale
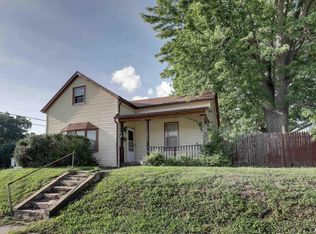
 MLS ID #CA1045911, Melissa Sullivan, Happel, Inc., REALTORS. RMLS Alliance as distributed by MLS GRID
- $69,9002 bd2 ba1.8k sqft623 S 7th St, Quincy, IL 62301New Construction
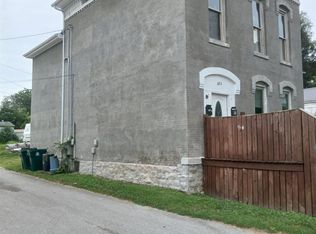 MLS ID #CA1046928, Travis Robbins, KW Hometown. RMLS Alliance as distributed by MLS GRID
- $94,9005 bd3 ba2.2k sqft1506-1508 Madison St, Quincy, IL 62301For Sale
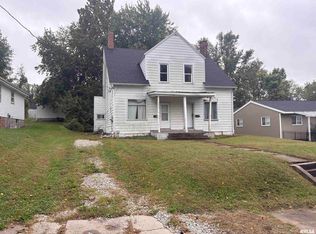 MLS ID #CA1047738, Kevin Carder, Happel, Inc., REALTORS. RMLS Alliance as distributed by MLS GRID
- $69,9003 bd1 ba1.3k sqft628 State St, Quincy, IL 62301Active
 MLS ID #100539065, Carol Shaffer, Bower & Associates, Inc., REALTORS. MRED as distributed by MLS GRID
- $89,9004 bd1 ba1.6k sqft1034 Jefferson St, Quincy, IL 62301For SaleMLS ID #CA1047014, Melissa Sullivan, Happel, Inc., REALTORS. RMLS Alliance as distributed by MLS GRID
- $40,0002 bd1 ba922 sqft1304 Elm St, Quincy, IL 62301For SaleMLS ID #CA1047711, Jacquelyn Weisenburger, Happel, Inc., REALTORS. RMLS Alliance as distributed by MLS GRID
- $57,5002 bd1 ba1.1k sqft327-329 Locust St, Quincy, IL 62301For SaleMLS ID #CA1047100, Jacquelyn Weisenburger, Happel, Inc., REALTORS. RMLS Alliance as distributed by MLS GRID
- $97,5002 bd1 ba1.2k sqft2050 Broadway St, Quincy, IL 62301For SaleMLS ID #CA1042088, Jenna Hendrickson, Davis & Associates, REALTORS. RMLS Alliance as distributed by MLS GRID
- $72,0003 bd1 ba1.2k sqft3001 Bird St, Hannibal, MO 63401For Sale
 MLS ID #26073068, Teree Haynes, Hannibal Realty LLC. MARIS
- $75,0002 bd2 ba1.2k sqft2007 Kingshighway, Hannibal, MO 63401For SaleMLS ID #26068684, Roselee A Ghattas, Ravenscraft Realty. MARIS
- $70,0002 bd1 ba992 sqft503 Olive St, Hannibal, MO 63401For SaleMLS ID #26072511, Soshia Tymchek, Century 21 Broughton Team. MARIS
- $85,0002 bd1 ba940 sqft2122 Spruce St, Hannibal, MO 63401For SaleMLS ID #26073553, Kelly A LaForce, Century 21 Broughton Team. MARIS
- $85,0004 bd3 ba1.9k sqft828 Bird St, Hannibal, MO 63401For SaleMLS ID #26058216, Jill Ricker, Prestige Realty, Inc. MARIS
- $70,0002 bd1 ba886 sqft1127 Sierra St, Hannibal, MO 63401For SaleMLS ID #26048495, Soshia Tymchek, Century 21 Broughton Team. MARIS
- $85,0002 bd1 ba992 sqft800 Bird St, Hannibal, MO 63401For SaleMLS ID #26070134, Jill Ricker, Prestige Realty, Inc. MARIS
- $99,9002 bd1 ba1.3k sqft501 N Chestnut St, Mendon, IL 62351For SaleMLS ID #CA1045805, Kelly Little, Farlow Real Estate Experts. RMLS Alliance as distributed by MLS GRID
- $109,0002 bd1 ba1.1k sqft302 S 5th St, La Grange, MO 63448For SaleMLS ID #26056449, Austin A Roberts, Bartz Realty, LLC. MARIS
