Under contract-accepting backup offers. Income-producing two-unit property, fully remodeled and currently generating $4,100/month in gross rent, with both units tenant-occupied. The single-story block/stucco home is set up as two independent units with separate entries: a 4-bedroom, 3-bath main unit and a 1-bedroom, 1-bath ADU with its own private entrance and lanai, 5 bedrooms and 4 full baths in all. Zoned R-4 with no HOA. A gated courtyard entry with double leaded-glass doors leads to large-format porcelain tile, recessed LED lighting, and new carpet in the bedrooms. Both kitchens have white shaker cabinetry and quartz counters, the baths are updated, and there's an inside laundry room. The backyard is split into two separately fenced yards, one for each unit, and the main unit has a screened lanai. Wide double driveway. Potential for a third unit. Minutes to the Gulf, shopping, and dining. Leases available to qualified buyers.
Accepting backups
$369,900
6224 KELLER DRIVE, PORT RICHEY, FL 34668
6beds
5baths
1,840sqft
Duplex, Multi Family
Built in 1973
-- sqft lot
$366,800 Zestimate®
$201/sqft
$-- HOA
What's special
Large-format porcelain tileRecessed led lightingInside laundry roomWide double driveway
- 10 days
- 288
- 46
Likely to sell faster than
Zillow last checked:
Listing updated:
Listed by:
John Aponte 352-345-6578,
PEOPLE'S TRUST REALTY 727-946-0904
Source: Stellar MLS,MLS#: TB8562004 Originating MLS: Suncoast Tampa
Facts & features
Interior
Bedrooms & bathrooms
- Bedrooms: 6
- Bathrooms: 5
Heating
- Central
Cooling
- Central Air
Appliances
- Laundry: Inside
Features
- Ceiling Fan(s), Living Room/Dining Room Combo
- Has fireplace: No
Interior area
- Total interior livable area: 1,840 sqft
Video & virtual tour
Property
Parking
- Parking features: Common
Features
- Exterior features: Lighting, Private Entrance, Private Yard
- Fencing: Fenced
Lot
- Size: 5,525 Square Feet
Details
- Parcel number: 162521056.A000.00112.0
- Zoning: R4
- Special conditions: None
Construction
Type & style
- Home type: MultiFamily
- Property subtype: Duplex, Multi Family
Materials
- Block, Stucco
- Foundation: Slab
- Roof: Shingle
Condition
- New construction: No
- Year built: 1973
Utilities & green energy
- Sewer: Public Sewer
- Water: Public
- Utilities for property: Public, Sewer Connected
Community & HOA
Community
- Pet fee: $0 monthly
- Subdivision: WEST PORT SUB
HOA
- Has HOA: No
Location
- Region: Port Richey
Financial & listing details
- Price per square foot: $201/sqft
- Tax assessed value: $229,603
- Annual tax amount: $4,077
- Date on market: 11/3/2026
- Cumulative days on market: 8 days
- Listing terms: Cash,Conventional,FHA
- Ownership: Fee Simple
- Lease term: 12 Months
- Total actual rent: 4100
- Tenant pays: Electricity
- Road surface type: Paved
Estimated market value
$366,800
$348,000 - $385,000
$2,086/mo
Price history
| Date | Event | Price |
|---|---|---|
| 11/3/2026 | Listed for sale | $369,900-10.9%$201/sqft |
Source:  Stellar MLS #TB8562004 Report a problem | ||
| 8/4/2026 | Listing removed | $415,000$226/sqft |
Source: Stellar MLS #TB8526700 Report a problem | ||
| 7/9/2026 | Listed for sale | $415,000+176.7%$226/sqft |
Source: Stellar MLS #TB8526700 Report a problem | ||
| 5/28/2025 | Sold | $150,000-5.1%$82/sqft |
Source: Public Record Report a problem | ||
| 2/20/2020 | Sold | $158,000-4.8%$86/sqft |
Source: Stellar MLS #W7818276 Report a problem | ||
| 1/2/2020 | Pending sale | $166,000$90/sqft |
Source: CHARLES RUTENBERG REALTY INC #W7818276 Report a problem | ||
| 12/4/2019 | Price change | $166,000-0.6%$90/sqft |
Source: CHARLES RUTENBERG REALTY INC #W7818276 Report a problem | ||
| 11/22/2019 | Price change | $167,000+5%$91/sqft |
Source: CHARLES RUTENBERG REALTY INC #W7818276 Report a problem | ||
| 10/26/2019 | Listed for sale | $159,000+27.2%$86/sqft |
Source: Owner Report a problem | ||
| 11/16/2017 | Listing removed | $1,275$1/sqft |
Source: Owner Report a problem | ||
| 11/8/2017 | Listed for rent | $1,275-1.9%$1/sqft |
Source: Owner Report a problem | ||
| 3/22/2017 | Listing removed | $125,000$68/sqft |
Source: Owner Report a problem | ||
| 1/10/2017 | Pending sale | $125,000$68/sqft |
Source: Owner Report a problem | ||
| 1/10/2017 | Price change | $125,000-10.1%$68/sqft |
Source: Owner Report a problem | ||
| 12/31/2016 | Listed for sale | $139,000+11.2%$76/sqft |
Source: Owner Report a problem | ||
| 2/10/2016 | Sold | $125,000+0.8%$68/sqft |
Source: Agent Provided Report a problem | ||
| 1/4/2016 | Price change | $124,000+18.1%$67/sqft |
Source: Owner Report a problem | ||
| 1/4/2016 | Listing removed | $1,300$1/sqft |
Source: Go Section8 Report a problem | ||
| 12/18/2015 | Listed for rent | $1,300-7.1%$1/sqft |
Source: Go Section8 Report a problem | ||
| 11/17/2015 | Listed for sale | $105,000+233.3%$57/sqft |
Source: Owner Report a problem | ||
| 6/13/2014 | Listing removed | $1,400$1/sqft |
Source: Go Section8 Report a problem | ||
| 5/13/2014 | Listed for rent | $1,400$1/sqft |
Source: Go Section8 Report a problem | ||
| 10/21/2011 | Sold | $31,501+1.6%$17/sqft |
Source: Public Record Report a problem | ||
| 9/3/2011 | Listed for sale | $31,000+18.8%$17/sqft |
Source: isNowListed.com Report a problem | ||
| 7/20/2011 | Sold | $26,100-75.1%$14/sqft |
Source: Public Record Report a problem | ||
| 3/24/2011 | Listing removed | $105,000$57/sqft |
Source: Owner Report a problem | ||
| 6/25/2009 | Listed for sale | $105,000+20.7%$57/sqft |
Source: Owner Report a problem | ||
| 1/10/2003 | Sold | $87,000+39.4%$47/sqft |
Source: Public Record Report a problem | ||
| 3/23/2001 | Sold | $62,400$34/sqft |
Source: Public Record Report a problem | ||
Public tax history
| Year | Property taxes | Tax assessment |
|---|---|---|
| 2025 | $4,077 +2.1% | $229,603 -7.1% |
| 2024 | $3,991 +5.4% | $247,203 +19.8% |
| 2023 | $3,785 +27.4% | $206,300 +11.7% |
| 2022 | $2,970 +11.8% | $184,752 +20.6% |
| 2021 | $2,657 +33.7% | $153,155 +45.6% |
| 2020 | $1,988 +12% | $105,180 +10% |
| 2019 | $1,774 | $95,620 +10% |
| 2018 | $1,774 +10.7% | $86,935 +4.2% |
| 2017 | $1,602 +1.9% | $83,436 +18.2% |
| 2016 | $1,572 +22.2% | $70,606 +4.4% |
| 2015 | $1,287 +12.7% | $67,628 +14% |
| 2014 | $1,142 | $59,317 +9.4% |
| 2013 | -- | $54,201 +0.7% |
| 2012 | -- | $53,826 -4.6% |
| 2011 | -- | $56,403 -1.2% |
| 2010 | -- | $57,106 -20.6% |
| 2009 | -- | $71,900 -33% |
| 2008 | -- | $107,373 -22.2% |
| 2007 | -- | $138,081 +1.8% |
| 2006 | -- | $135,574 +18.9% |
| 2005 | -- | $114,037 +38.8% |
| 2004 | -- | $82,186 +4.8% |
| 2003 | -- | $78,394 +21.2% |
| 2002 | -- | $64,690 +25.1% |
| 2000 | -- | $51,709 |
| 1999 | -- | $51,709 |
Find assessor info on the county website
Monthly payment
Est. payment
Payment breakdown
Explore the cost of this home by adjusting the details. Changes won't be saved.Climate risks
Neighborhood: West Port


Similar homes
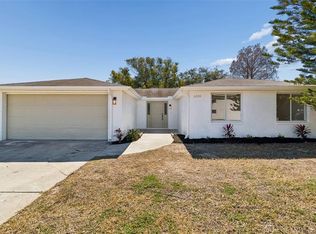
- $375,0003 bd2 ba1.5k sqft5440 QUIST DRIVE, PORT RICHEY, FL 34668For Sale
 MLS ID #TB8565514, Tiia Cartwright, CARTWRIGHT REALTY. Stellar MLS
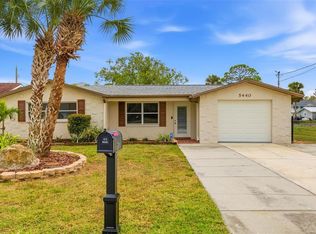
- $349,9003 bd3 ba1.5k sqft5254 MILLER BAYOU DRIVE, PORT RICHEY, FL 34668For Sale
 MLS ID #TB8530139, Ramy Nassief, INFINITY REALTY & INVESTMENT. Stellar MLS
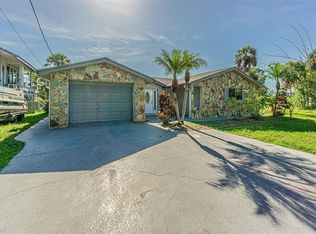
- $395,0003 bd2 ba1.7k sqft13909 BERKOWITZ AVENUE, HUDSON, FL 34667For Sale
 MLS ID #TB8564390, Will Daoud, LPT REALTY, LLC. Stellar MLS
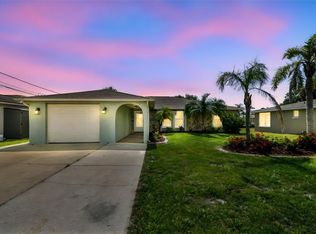
- $325,0003 bd3 ba1.5k sqft8428 PAXTON DRIVE, PORT RICHEY, FL 34668For Sale
 MLS ID #W7890311, Janina Wozniak, FUTURE HOME REALTY. Stellar MLS
- $230,0003 bd2 ba984 sqft9135 SUFFOLK LANE, PORT RICHEY, FL 34668For SaleMLS ID #TB8566469, Rafael Ricardo, HOME PRIME REALTY LLC. Stellar MLS
- $299,0003 bd2 ba1.8k sqft7403 FOXBLOOM DRIVE, PORT RICHEY, FL 34668For SaleMLS ID #TB8559123, David O'Brien, STAR BAY REALTY CORP.. Stellar MLS
- $359,0003 bd2 ba1.6k sqft13618 PARKWOOD STREET, HUDSON, FL 34669For SaleMLS ID #TB8565272, Isabela Morejon Alfonso, BELLA VISTA REALTY GROUP LLC. Stellar MLS
- $349,0004 bd3 ba2k sqft12204 LONGSTRAP LANE, HUDSON, FL 34667For SaleMLS ID #TB8561175, Douglas Dodd, FUTURE HOME REALTY INC. Stellar MLS
- $299,0003 bd2 ba1.1k sqft9516 GRAY FOX LANE, PORT RICHEY, FL 34668For SaleMLS ID #TB8554726, Dani Achim, PLATINUM DOLPHIN REALTY. Stellar MLS
- $399,0004 bd3 ba2.1k sqft11666 SEMINOLE DRIVE, NEW PORT RICHEY, FL 34654For SaleMLS ID #TB8542545, Andzelika Duraj, FUTURE HOME REALTY INC. Stellar MLS
- $250,0003 bd2 ba1.5k sqft7340 MAYFIELD DRIVE, PORT RICHEY, FL 34668For SaleMLS ID #O6448882, Dave Giampietri, LLC, EXP REALTY LLC. Stellar MLS
- $287,0003 bd2 ba1.4k sqft8923 CANDLEWICK LANE, PORT RICHEY, FL 34668For SaleMLS ID #TB8503267, Odalis Perez Gonzalez, PEREZ HOME REALTY LLC. Stellar MLS
- $250,0003 bd2 ba1.4k sqft10734 LEEDS ROAD, PORT RICHEY, FL 34668For SaleMLS ID #W7890159, Adnan Latic, EXP REALTY LLC. Stellar MLS
- $365,0004 bd3 ba2.4k sqft7010 SOUTHWIND DRIVE, HUDSON, FL 34667For SaleMLS ID #O6435281, Raquel Littlejohn, MAINSTAY BROKERAGE LLC. Stellar MLS
- $375,0003 bd2 ba2.1k sqft6236 HOPEWELL DRIVE, HOLIDAY, FL 34690For SaleMLS ID #TB8555241, Yari Balmaseda, BALMASEDA & ASSOCIATES INC. Stellar MLS
- $253,5003 bd2 ba1.4k sqft11011 PICKERING LANE, PORT RICHEY, FL 34668For SaleMLS ID #TB8528571, Alexandria Stein, PEOPLE'S TRUST REALTY. Stellar MLS
- $399,9003 bd2 ba1.6k sqft18606 ALEXSON STREET, SPRING HILL, FL 34610For SaleMLS ID #A4712375, William Gryboski, RIDER REAL ESTATE. Stellar MLS
- $249,9003 bd2 ba1.3k sqft7207 SANDALWOOD DRIVE, PORT RICHEY, FL 34668For SaleMLS ID #O6427854, Robert Salmons, ENTERA REALTY LLC. Stellar MLS
- $269,9003 bd2 ba1.3k sqft7255 FIRESIDE DRIVE, PORT RICHEY, FL 34668For SaleMLS ID #O6395695, Robert Salmons, ENTERA REALTY LLC. Stellar MLS
- $349,9903 bd2 ba1.4k sqft13615 GARRIS DRIVE, HUDSON, FL 34667For SaleMLS ID #TB8500515, Chris Jhoda, REAL BROKER, LLC. Stellar MLS
