Lovely 2 floor townhouse, 2 bedroom, 2 1/2 bath, central A/C,
screened in patio, laundry room with washer/dryer , overlooking pond. Pool, wall-ball, short walk to Pinebrook Park with playground, dog park, basketball and new Pickle Ball court. Close to schools and transportation
For sale by owner
Price cut: $28K (10/25)
$163,000
6701 121st Ave APT B, Largo, FL 33773
2beds
1,100sqft
Townhouse
Built in 1986
732 Square Feet Lot
$-- Zestimate®
$148/sqft
$384/mo HOA
What's special
Overlooking pondScreened in patio
- 12 days
- 410
- 41
Listed by:
Property Owner (727) 533-9323
Facts & features
Interior
Bedrooms & bathrooms
- Bedrooms: 2
- Bathrooms: 3
- Full bathrooms: 2
- 1/2 bathrooms: 1
Heating
- Forced air
Cooling
- Central
Appliances
- Included: Microwave, Range / Oven, Refrigerator
Features
- Flooring: Tile, Carpet
- Basement: None
Interior area
- Total interior livable area: 1,100 sqft
Property
Parking
- Total spaces: 1
- Parking features: On-street
Features
- Exterior features: Stucco
- Has view: Yes
- View description: Water
- Has water view: Yes
- Water view: Water
Lot
- Size: 732 Square Feet
Details
- Parcel number: 073016690590000340
Construction
Type & style
- Home type: Townhouse
Materials
- Frame
- Roof: Shake / Shingle
Condition
- New construction: No
- Year built: 1986
Community & HOA
HOA
- Has HOA: Yes
- HOA fee: $384 monthly
Location
- Region: Largo
Financial & listing details
- Price per square foot: $148/sqft
- Tax assessed value: $199,707
- Annual tax amount: $2,953
- Date on market: 10/21/2026
Estimated market value
Not available
Estimated sales range
Not available
$1,934/mo
Price history
| Date | Event | Price |
|---|---|---|
| 10/25/2026 | Price change | $163,000-14.7%$148/sqft |
Source: Owner Report a problem | ||
| 10/21/2026 | Listed for sale | $191,000-11.6%$174/sqft |
Source: Owner Report a problem | ||
| 1/15/2026 | Listing removed | $1,700$2/sqft |
Source: Zillow Rentals Report a problem | ||
| 12/25/2025 | Listed for rent | $1,700$2/sqft |
Source: Zillow Rentals Report a problem | ||
| 12/25/2025 | Listing removed | -- |
Source: Owner Report a problem | ||
| 11/23/2025 | Price change | $216,000-4%$196/sqft |
Source: Owner Report a problem | ||
| 10/6/2025 | Listed for sale | $225,000-0.7%$205/sqft |
Source: Owner Report a problem | ||
| 10/5/2025 | Listing removed | $1,700$2/sqft |
Source: Zillow Rentals Report a problem | ||
| 9/18/2025 | Listing removed | -- |
Source: Owner Report a problem | ||
| 9/14/2025 | Listed for rent | $1,700+55.3%$2/sqft |
Source: Zillow Rentals Report a problem | ||
| 7/2/2025 | Listed for sale | $226,500+566.2%$206/sqft |
Source: Owner Report a problem | ||
| 3/24/2021 | Listing removed | -- |
Source: Owner Report a problem | ||
| 4/14/2017 | Listing removed | $1,095$1/sqft |
Source: Owner Report a problem | ||
| 3/15/2017 | Listed for rent | $1,095$1/sqft |
Source: Owner Report a problem | ||
| 4/27/2016 | Listing removed | $1,095+4.3%$1/sqft |
Source: Owner Report a problem | ||
| 4/8/2014 | Listing removed | $1,050$1/sqft |
Source: Postlets Report a problem | ||
| 12/16/2013 | Listed for rent | $1,050$1/sqft |
Source: Postlets Report a problem | ||
| 11/4/2013 | Sold | $34,000-19%$31/sqft |
Source: Public Record Report a problem | ||
| 9/5/2013 | Listed for sale | $42,000$38/sqft |
Source: Owner Report a problem | ||
| 5/31/2013 | Listing removed | $42,000$38/sqft |
Source: Buxton Properties, Inc. #U7579475 Report a problem | ||
| 4/23/2013 | Listed for sale | $42,000-19.2%$38/sqft |
Source: Buxton Properties, Inc. #U7579475 Report a problem | ||
| 9/2/1999 | Sold | $52,000$47/sqft |
Source: Public Record Report a problem | ||
Public tax history
| Year | Property taxes | Tax assessment |
|---|---|---|
| 2025 | $2,953 +4.8% | $127,641 +10% |
| 2024 | $2,818 +7.1% | $116,037 +10% |
| 2023 | $2,631 +18.5% | $105,488 +10% |
| 2022 | $2,220 +11.2% | $95,898 +10% |
| 2021 | $1,995 +9.2% | $87,180 +10% |
| 2020 | $1,828 +8.2% | $79,255 +10% |
| 2019 | $1,689 | $72,050 -23% |
| 2018 | $1,689 +10.5% | $93,548 +34.7% |
| 2017 | $1,528 +24.4% | $69,451 +4.9% |
| 2016 | $1,228 +10.8% | $66,205 +20.2% |
| 2015 | $1,109 +14.2% | $55,076 +23.1% |
| 2014 | $970 -2.1% | $44,737 -1% |
| 2013 | $991 +136.8% | $45,198 +2.5% |
| 2012 | $418 | $44,100 -16.8% |
| 2011 | -- | $52,990 +1.5% |
| 2010 | -- | $52,207 +2.7% |
| 2009 | -- | $50,834 +0.1% |
| 2008 | $511 | $50,783 +3% |
| 2007 | -- | $49,304 -37.6% |
| 2005 | -- | $79,000 +11.7% |
| 2004 | $455 +3.5% | $70,700 +16.7% |
| 2003 | $439 +7.6% | $60,600 +26.5% |
| 2002 | $408 | $47,900 +11.4% |
| 2001 | $408 -0.6% | $43,000 -0.5% |
| 2000 | $411 | $43,200 |
Find assessor info on the county website
Monthly payment
Est. payment
Payment breakdown
Explore the cost of this home by adjusting the details. Changes won't be saved.Climate risks
Neighborhood: 33773


Similar homes
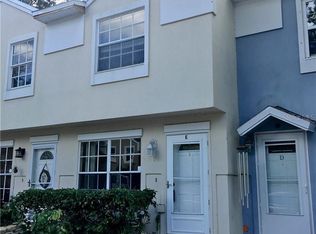
- $149,0002 bd2 ba1.1k sqft5750 80TH STREET N #B203, ST PETERSBURG, FL 33709For Sale

 MLS ID #TB8478065, Henry Tran Louden, EMPRESS HOME REALTY, INC.. Stellar MLS
- $159,9002 bd2 ba900 sqft8151 HEATHERWOOD DRIVE #111, SEMINOLE, FL 33777For Sale
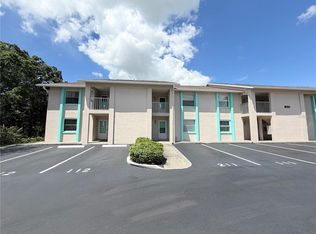 MLS ID #TB8559956, Milagritos Guzman, COMPASS FLORIDA LLC. Stellar MLS
- $195,0002 bd2 ba1k sqft9209 SEMINOLE BOULEVARD #67, SEMINOLE, FL 33772For Sale
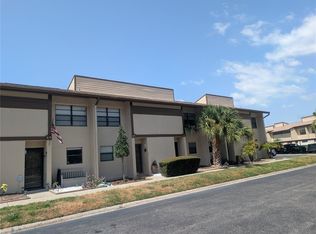 MLS ID #TB8528003, Lucy Scheuringer, REALTY CONCEPTS OF PINELLAS. Stellar MLS
- $154,0002 bd2 ba1.1k sqft7951 58TH AVENUE N #207, ST PETERSBURG, FL 33709For Sale
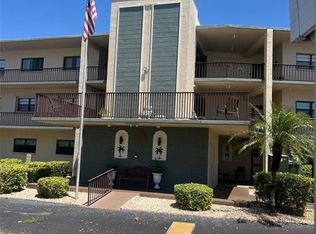 MLS ID #TB8478464, Henry Tran Louden, EMPRESS HOME REALTY, INC.. Stellar MLS
- $145,0002 bd2 ba900 sqft6301 58TH STREET N #501, PINELLAS PARK, FL 33781For SaleMLS ID #TB8508505, Tom Byrnes, EXP REALTY LLC. Stellar MLS
- $185,0002 bd2 ba1.1k sqft12300 PARK BOULEVARD #101, SEMINOLE, FL 33772For SaleMLS ID #TB8541461, Jillian Gibson, STOFEL & ASSOCIATES REALTY. Stellar MLS
- $155,0002 bd1 ba1k sqft337 S MCMULLEN BOOTH ROAD #157, CLEARWATER, FL 33759For SaleMLS ID #TB8395041, Jeannie Merrick, EMBASSY REAL ESTATE GROUP INC. Stellar MLS
- $165,0002 bd1 ba922 sqft851 N KEENE ROAD #Y7, CLEARWATER, FL 33755For SaleMLS ID #TB8520067, Riccardo Santagostino, GREAT HOMES REALTY INC. Stellar MLS
- $169,9002 bd1 ba1k sqft387 S MCMULLEN BOOTH ROAD #13, CLEARWATER, FL 33759For SaleMLS ID #TB8478717, Eric Szemple, KELLER WILLIAMS REALTY- PALM HARBOR. Stellar MLS
- $164,0002 bd2 ba1.1k sqft11901 4TH STREET N #7107, ST PETERSBURG, FL 33716For SaleMLS ID #TB8499160, Amanda Aldis, PRISTINE BAY REAL ESTATE SERVICES. Stellar MLS
- $155,0002 bd2 ba1.1k sqft2330 ECUADORIAN WAY #32, CLEARWATER, FL 33763For SaleMLS ID #TB8488701, Rose Parsons, DALTON WADE INC. Stellar MLS
- $161,0003 bd2 ba985 sqft1400 GANDY BOULEVARD N #803, ST PETERSBURG, FL 33702For SaleMLS ID #TB8547225, Zach Steinberger, COMPASS FLORIDA LLC. Stellar MLS
- $179,9002 bd2 ba1.1k sqft2583 COUNTRYSIDE BOULEVARD #3201, CLEARWATER, FL 33761For SaleMLS ID #TB8540904, Tammie Fraser, EXP REALTY LLC. Stellar MLS
- $159,0002 bd2 ba960 sqft4435 1ST STREET NE #111, ST PETERSBURG, FL 33703For SaleMLS ID #TB8548370, Danielle Shaw, BHHS FLORIDA PROPERTIES GROUP. Stellar MLS
- $135,0002 bd2 ba1.1k sqft2426 PERSIAN DRIVE #64, CLEARWATER, FL 33763For SaleMLS ID #TB8555263, Deb Bonomo, BONOMO REALTY LLC. Stellar MLS
- $117,0001 bd1 ba667 sqft8304 BARDMOOR BOULEVARD #203 (22), SEMINOLE, FL 33777For SaleMLS ID #TB8561582, Jeff Glass, SEMINOLE REALTY. Stellar MLS
- $162,9002 bd1 ba875 sqft1701 PINEHURST ROAD #16G, DUNEDIN, FL 34698For SaleMLS ID #TB8541443, Angela Marsh, PA, KELLER WILLIAMS REALTY PORTFOLIO COLLECTION. Stellar MLS
- $119,9002 bd2 ba1.1k sqft5920 80TH STREET N #308, ST PETERSBURG, FL 33709For SaleMLS ID #TB8516172, Mary Butler, REALTY EXPERTS. Stellar MLS
- $219,0002 bd2 ba1.1k sqft2980 HAINES BAYSHORE ROAD #134, CLEARWATER, FL 33760For SaleMLS ID #TB8545822, Brenda Frieri, BLAKE REAL ESTATE INC. Stellar MLS
