Move-In Ready Home in Nice Citrus Heigths Location! Just updated with New Granite Counters, New Kitchen Appliances, New Carpet, & Fresh Paint! County shows 4 Bedrooms but really has 5 rooms that could be bedrooms, just 2 do not have closets. Some hardwood floors under carpet. Better hurry on this one!
Pre-foreclosure
Est. $468,800
6836 Florabelle Ave, Citrus Heights, CA 95621
3beds
3baths
1,596sqft
SingleFamily
Built in 1961
6,969 Square Feet Lot
$468,800 Zestimate®
$294/sqft
$-- HOA
Overview
- 23 days
- 11
- 0
Facts & features
Interior
Bedrooms & bathrooms
- Bedrooms: 3
- Bathrooms: 3
Heating
- Other
Cooling
- Central
Features
- Has fireplace: Yes
Interior area
- Total interior livable area: 1,596 sqft
Property
Parking
- Parking features: Garage - Attached
Lot
- Size: 6,969 Square Feet
Details
- Parcel number: 20401820040000
Construction
Type & style
- Home type: SingleFamily
Materials
- wood frame
- Roof: Composition
Condition
- Year built: 1961
Community & HOA
Location
- Region: Citrus Heights
Financial & listing details
- Price per square foot: $294/sqft
- Tax assessed value: $340,926
Foreclosure details
Estimated market value
$468,800
$445,000 - $492,000
$2,492/mo
Price history
| Date | Event | Price |
|---|---|---|
| 4/14/2017 | Sold | $288,000+59.6%$180/sqft |
Source: MetroList Services of CA #17011081 Report a problem | ||
| 12/21/2012 | Sold | $180,500+3.2%$113/sqft |
Source: Public Record Report a problem | ||
| 10/17/2012 | Listed for sale | $174,900+23.2%$110/sqft |
Source: foreclosure.com Report a problem | ||
| 6/13/2012 | Sold | $142,000-27.6%$89/sqft |
Source: Public Record Report a problem | ||
| 7/16/2002 | Sold | $196,000$123/sqft |
Source: Public Record Report a problem | ||
Public tax history
| Year | Property taxes | Tax assessment |
|---|---|---|
| 2026 | -- | $340,926 +2% |
| 2025 | $6,828 +16.5% | $334,242 +2% |
| 2024 | $5,860 -11.9% | $327,690 +2% |
| 2023 | $6,649 +21.6% | $321,266 +2% |
| 2022 | $5,466 -12.4% | $314,967 +2% |
| 2021 | $6,239 +20.9% | $308,792 +1% |
| 2020 | $5,159 +11.2% | $305,627 +2% |
| 2019 | $4,639 +10.4% | $299,635 +2% |
| 2018 | $4,203 +77.1% | $293,760 +53.4% |
| 2017 | $2,373 +7% | $191,513 +2% |
| 2016 | $2,218 +3.9% | $187,758 +1.5% |
| 2015 | $2,135 | $184,939 +2% |
| 2014 | $2,135 | $181,318 +0.5% |
| 2013 | -- | $180,500 +17% |
| 2012 | -- | $154,212 -6% |
| 2011 | -- | $164,057 -8% |
| 2010 | -- | $178,323 -17.4% |
| 2008 | -- | $215,836 +2% |
| 2007 | -- | $211,605 +2% |
| 2006 | -- | $207,457 +2% |
| 2005 | -- | $203,390 +2% |
| 2004 | -- | $199,403 +1.9% |
| 2003 | -- | $195,750 +44.6% |
| 2002 | -- | $135,388 +2% |
| 2001 | -- | $132,734 +14.3% |
| 2000 | -- | $116,171 |
Find assessor info on the county website
Monthly payment
Climate risks
Neighborhood: Rusch Park
- $459,9003 bd2 ba1.7k sqft6842 Florabelle Ave, Citrus Heights, CA 95621Off Market
- $412,0003 bd2 ba1.2k sqft6830 Florabelle Ave, Citrus Heights, CA 95621Off Market
- $491,4003 bd2 ba1.6k sqft6848 Florabelle Ave, Citrus Heights, CA 95621Off Market

- $388,5002 bd1 ba968 sqft6824 Florabelle Ave, Citrus Heights, CA 95621Off Market
Similar homes
- $439,0003 bd2 ba1.1k sqft7372 Black Oaks Way, Citrus Heights, CA 95621For Sale
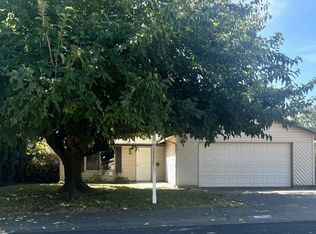 MLS ID #226129814, Kallie Orr Orr. MetroList Services of CA
- $--3 bd2 ba1.1k sqft8244 Summerplace Dr, Citrus Heights, CA 95621Auction
 Auction.com 2
- $419,0003 bd2 ba1.1k sqft7975 Lichen Dr, Citrus Heights, CA 95621For Sale
 MLS ID #226129912, Kevin McDonald. MetroList Services of CA
- $499,0003 bd2 ba1.2k sqft7217 Springleaf Court, Citrus Heights, CA 95621For Sale
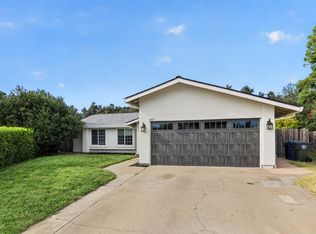 MLS ID #226128816, Jesse Bassler, Realty Agents Inc. BAREIS
