Prime location 3 bed 1 bath condo at the front of Mission Hill. Current rent 4000/month, extremely solid rental history, sub 5 minute commute to Orange Line, sub 10 minute commute to Green Line, easy access to Longwood Medical and Fenway colleges. Shopping, restaurants, buses, groceries within 10 minutes. Brand new laundry in unit, spacious common area roof deck with city views.
Pending
$512,500
743 Parker St #3, Roxbury, MA 02120
3beds
835sqft
Condominium
Built in 1899
-- sqft lot
$656,800 Zestimate®
$614/sqft
$192/mo HOA
What's special
- 48 days
- 13
- 0
Zillow last checked:
Listing updated:
Listed by:
Preston Hicks 617-651-0163,
Boston Realty Online, Inc. 617-383-7501,
Preston Hicks 617-651-0163
Source: MLS PIN,MLS#: 73050549
Facts & features
Interior
Bedrooms & bathrooms
- Bedrooms: 3
- Bathrooms: 1
- Full bathrooms: 1
Heating
- Baseboard, Natural Gas
Cooling
- None
Appliances
- Laundry: In Unit
Features
- Has basement: Yes
- Has fireplace: No
- Common walls with other units/homes: 2+ Common Walls,Corner
Interior area
- Total structure area: 835
- Total interior livable area: 835 sqft
- Finished area above ground: 835
Property
Parking
- Total spaces: 1
- Parking features: Off Street, Deeded
- Uncovered spaces: 1
Features
- Entry location: Unit Placement(Front)
- Patio & porch: Deck - Roof
- Exterior features: Deck - Roof
Details
- Parcel number: 3393591
- Zoning: 0102
Construction
Type & style
- Home type: Condo
- Architectural style: Other (See Remarks)
- Property subtype: Condominium
Condition
- Year built: 1899
Utilities & green energy
- Sewer: Public Sewer
- Water: Public
Community & HOA
HOA
- Services included: Water, Sewer, Insurance
- HOA fee: $192 monthly
Location
- Region: Roxbury
Financial & listing details
- Price per square foot: $614/sqft
- Tax assessed value: $440,200
- Annual tax amount: $4,787
- Date on market: 9/26/2026
- Listing terms: Seller W/Participate
Estimated market value
$656,800
$539,000 - $808,000
$3,985/mo
Price history
| Date | Event | Price |
|---|---|---|
| 11/13/2026 | Listed for rent | $5,400$6/sqft |
Source: Zillow Rentals Report a problem | ||
| 11/8/2026 | Listing removed | $5,400$6/sqft |
Source: Zillow Rentals Report a problem | ||
| 11/7/2026 | Listed for rent | $5,400+10.2%$6/sqft |
Source: Zillow Rentals Report a problem | ||
| 9/23/2026 | Pending sale | $512,500$614/sqft |
Source: MLS PIN #73050549 Report a problem | ||
| 8/18/2026 | Listing removed | $4,900$6/sqft |
Source: Zillow Rentals Report a problem | ||
| 5/27/2026 | Price change | $4,900-5.8%$6/sqft |
Source: Zillow Rentals Report a problem | ||
| 4/28/2026 | Listed for rent | $5,200+8.3%$6/sqft |
Source: Zillow Rentals Report a problem | ||
| 4/28/2026 | Listing removed | $4,800$6/sqft |
Source: Zillow Rentals Report a problem | ||
| 1/12/2026 | Listed for rent | $4,800-7.7%$6/sqft |
Source: Zillow Rentals Report a problem | ||
| 12/20/2025 | Listing removed | $5,200$6/sqft |
Source: Zillow Rentals Report a problem | ||
| 12/5/2025 | Listed for rent | $5,200+62.5%$6/sqft |
Source: Zillow Rentals Report a problem | ||
| 10/20/2022 | Listed for sale | $512,500+46.8%$614/sqft |
Source: MLS PIN #73050549 Report a problem | ||
| 7/28/2017 | Listing removed | $3,200$4/sqft |
Source: Zillow Rental Manager Report a problem | ||
| 7/22/2017 | Listed for rent | $3,200-35.4%$4/sqft |
Source: Zillow Rental Manager Report a problem | ||
| 4/24/2017 | Listing removed | $4,950$6/sqft |
Source: Hillway Realty Report a problem | ||
| 3/30/2017 | Price change | $4,950+23.8%$6/sqft |
Source: Hillway Realty Report a problem | ||
| 1/30/2017 | Listed for rent | $4,000$5/sqft |
Source: Boston Brokerage Group Report a problem | ||
| 7/21/2010 | Listing removed | $349,000$418/sqft |
Source: Owner Report a problem | ||
| 2/28/2010 | Price change | $349,000+6.1%$418/sqft |
Source: Owner Report a problem | ||
| 1/28/2010 | Listed for sale | $329,000+26.5%$394/sqft |
Source: Owner Report a problem | ||
| 9/17/2009 | Sold | $260,000+490.9%$311/sqft |
Source: Public Record Report a problem | ||
| 12/18/1996 | Sold | $44,000+4300%$53/sqft |
Source: Public Record Report a problem | ||
| 8/1/1990 | Sold | $1,000$1/sqft |
Source: Public Record Report a problem | ||
Public tax history
| Year | Property taxes | Tax assessment |
|---|---|---|
| 2025 | $5,558 +7.1% | $480,000 +0.8% |
| 2024 | $5,191 +4.6% | $476,200 +3% |
| 2023 | $4,964 +3.7% | $462,200 +5% |
| 2022 | $4,789 +2% | $440,200 |
| 2021 | $4,697 +11% | $440,200 +9.9% |
| 2020 | $4,230 +8.2% | $400,600 +8% |
| 2019 | $3,909 +8.6% | $370,900 +7.9% |
| 2018 | $3,601 +340.6% | $343,600 +7% |
| 2017 | $817 -75% | $321,000 +8% |
| 2016 | $3,269 +1.5% | $297,200 +11.7% |
| 2015 | $3,222 +15.3% | $266,100 +25.1% |
| 2013 | $2,795 0% | $212,700 -0.8% |
| 2012 | $2,796 +8.2% | $214,400 +6.1% |
| 2011 | $2,585 +32% | $202,100 +22.6% |
| 2010 | $1,958 +12.6% | $164,800 +0.7% |
| 2009 | $1,739 -19.3% | $163,600 -16.7% |
| 2008 | $2,155 -0.8% | $196,400 -0.7% |
| 2007 | $2,173 | $197,700 |
Find assessor info on the county website
Monthly payment
Est. payment
Payment breakdown
Explore the cost of this home by adjusting the details. Changes won't be saved.Climate risks
Neighborhood: Mission Hill


Similar homes
- $525,0002 bd1 ba950 sqft378-386 Riverway Condominium, Boston, MA 02115For Sale
 MLS ID #73598948, Mila Zaizerskaya, eXp Realty LLC. MLS PIN
- $525,0001 bd1 ba950 sqft378-386 Riverway Condominium, Boston, MA 02115For Sale
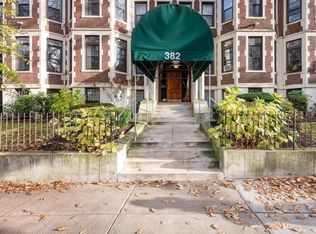 MLS ID #73593153, Mila Zaizerskaya, eXp Realty LLC. MLS PIN
- $495,5002 bd1 ba760 sqftSutherland Place Condominium, Brighton, MA 02135For Sale
 MLS ID #73599944, James Kopecky, Red Tree Real Estate. MLS PIN
- $499,9993 bd2 ba1.1k sqft309 Wood Ave #3, Hyde Park, MA 02136For Sale
 MLS ID #73560434, Team Galvin, The Galvin Group, LLC. MLS PIN
