$747,300
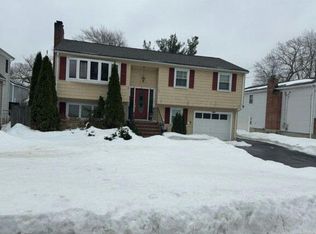
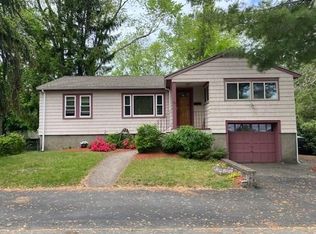
4 bd1 ba1.7k sqft
56 Fisher Rd, Dedham, MA 02026
Off Market
Likely to sell faster than
Zillow last checked:
Listing updated:
Mary Ellen Martin 857-204-7445,
Mary Ellen Martin 857-204-7445,
Mary Ellen Martin 857-204-7445
$523,800
$487,000 - $560,000
$3,380/mo
| Date | Event | Price |
|---|---|---|
| 9/23/2026 | Pending sale | $550,000$492/sqft |
Source: MLS PIN #73465426 Report a problem | ||
| 1/5/2026 | Listed for sale | $550,000$492/sqft |
Source: MLS PIN #73465426 Report a problem | ||
| Year | Property taxes | Tax assessment |
|---|---|---|
| 2025 | $6,962 +8.4% | $551,700 +7.3% |
| 2024 | $6,425 +4.3% | $514,000 +7.2% |
| 2023 | $6,158 +5.5% | $479,600 +9.7% |
| 2022 | $5,837 +8.8% | $437,200 +11.4% |
| 2021 | $5,363 -0.4% | $392,300 |
| 2020 | $5,382 +6.7% | $392,300 +10% |
| 2019 | $5,046 +4% | $356,600 +7% |
| 2018 | $4,851 +4.3% | $333,400 +5.8% |
| 2017 | $4,649 +3.2% | $315,000 +8.4% |
| 2016 | $4,503 +0.5% | $290,700 +3% |
| 2015 | $4,480 -0.1% | $282,300 +1.2% |
| 2014 | $4,485 +5% | $278,900 +3.1% |
| 2013 | $4,273 -2.3% | $270,600 -4.5% |
| 2012 | $4,373 +14.7% | $283,400 +6.8% |
| 2011 | $3,812 +3.3% | $265,300 -2.5% |
| 2010 | $3,692 +0.5% | $272,100 -6.6% |
| 2009 | $3,675 +4% | $291,200 -0.6% |
| 2008 | $3,532 -7.8% | $293,100 -16.4% |
| 2007 | $3,830 +11.6% | $350,400 +13.8% |
| 2006 | $3,433 +14.5% | $307,900 +7.6% |
| 2005 | $2,998 +77.6% | $286,100 +73.4% |
| 2004 | $1,688 -27.1% | $165,000 |
| 2003 | $2,315 +4.9% | $165,000 |
| 2002 | $2,206 +15.3% | $165,000 +21.1% |
| 1999 | $1,914 | $136,200 |


A local agent can set up tours, give advice and negotiate with sellers.