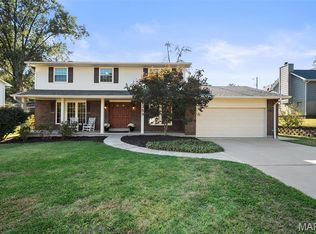
$363,300
3 bd2 ba-- sqft
7724 Sunray Ln, Affton, MO 63123
Off Market
Zillow last checked:
Listing updated:
Jim VonDerHaar 314-494-8874,
Berkshire Hathaway HomeServices Select Properties
 Originating MLS: St. Louis Association of REALTORS
$416,200
$391,000 - $441,000
$2,331/mo
| Date | Event | Price |
|---|---|---|
| 4/28/2016 | Sold | -- |
Source:  MARIS #16015648 Report a problem | ||
| 3/21/2016 | Pending sale | $234,900$112/sqft |
Source: RE/MAX Results #16015648 Report a problem | ||
| 3/16/2016 | Listed for sale | $234,900+25%$112/sqft |
Source: RE/MAX Results #16015648 Report a problem | ||
| 3/22/2013 | Sold | -- |
Source: MARIS #12059674 Report a problem | ||
| 2/22/2013 | Listed for sale | $187,900$89/sqft |
Source: REALTY EXECUTIVES of St. Louis #12059674 Report a problem | ||
| 1/1/2013 | Listing removed | $187,900$89/sqft |
Source: REALTY EXECUTIVES of St. Louis #12059674 Report a problem | ||
| 11/21/2012 | Price change | $187,900-10.5%$89/sqft |
Source: REALTY EXECUTIVES of St. Louis #12059674 Report a problem | ||
| 10/19/2012 | Listed for sale | $209,900-17.7%$100/sqft |
Source: REALTY EXECUTIVES of St. Louis #12059674 Report a problem | ||
| 3/24/2011 | Listing removed | $254,900$121/sqft |
Source: Owner Report a problem | ||
| 10/20/2009 | Price change | $254,900-3.8%$121/sqft |
Source: Owner Report a problem | ||
| 5/1/2009 | Listed for sale | $264,900-1.5%$126/sqft |
Source: Owner Report a problem | ||
| 10/3/2008 | Price change | $269,000-3.6%$128/sqft |
Source: Owner Report a problem | ||
| 8/8/2008 | Listed for sale | $279,000$133/sqft |
Source: Owner Report a problem | ||
| Year | Property taxes | Tax assessment |
|---|---|---|
| 2025 | $5,125 +18.6% | $75,620 +21.5% |
| 2024 | $4,320 +8.2% | $62,230 |
| 2023 | $3,993 +3.2% | $62,230 +15.8% |
| 2022 | $3,870 +9.7% | $53,720 |
| 2021 | $3,526 +10.5% | $53,720 +14.7% |
| 2020 | $3,191 +4.9% | $46,850 |
| 2019 | $3,043 | $46,850 +15.4% |
| 2018 | $3,043 | $40,590 |
| 2017 | $3,043 +1.1% | $40,590 +6.4% |
| 2016 | $3,010 +7.7% | $38,160 |
| 2015 | $2,795 | $38,160 +1.1% |
| 2014 | $2,795 -0.5% | $37,730 |
| 2013 | $2,809 | $37,730 -5.3% |
| 2012 | -- | $39,860 |
| 2011 | -- | $39,860 +0.7% |
| 2010 | $2,363 +4.4% | $39,580 |
| 2009 | $2,264 -8.8% | $39,580 -8% |
| 2008 | $2,483 +11.4% | $43,030 |
| 2007 | $2,229 | $43,030 +12.5% |
| 2006 | $2,229 +2.4% | $38,260 |
| 2005 | $2,178 | $38,260 +23.5% |
| 2003 | -- | $30,990 +0.4% |
| 2002 | $1,661 +26.6% | $30,870 |
| 2001 | $1,312 | $30,870 |
Source: MARIS. This data may not be complete. We recommend contacting the local school district to confirm school assignments for this home.
A local agent can set up tours, give advice and negotiate with sellers.
A local lender can help you make sure your offer is ready when you are.