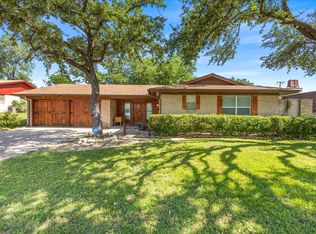
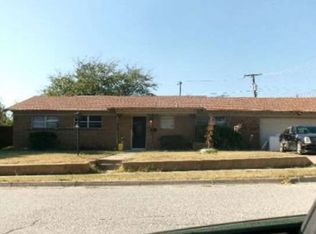
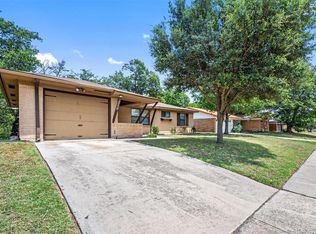
Looking for an investment opportunity in a vibrant community or a handyman special in a great location? Look no further! This charming 3-bedroom, 2-bath home is situated in the highly sought-after Benbrook area. This property is being sold AS-IS. Come see it while you can!
Pending
Price cut: $34K (6/12)
$215,000
8012 Chapin Rd, Benbrook, TX 76116
3beds
2,025sqft
Single Family Residence
Built in 1964
10,323 Square Feet Lot
$208,100 Zestimate®
$106/sqft
$-- HOA
What's special
- 19 days |
- 943 |
- 45 |
Likely to sell faster than
Zillow last checked:
Listing updated:
Listed by:
Reid Hill 0837982,
Legacy Buyer Partners 214-729-3490
Source: NTREIS,MLS#: 21285452
Facts & features
Interior
Bedrooms & bathrooms
- Bedrooms: 3
- Bathrooms: 2
- Full bathrooms: 2
Primary bedroom
- Level: First
- Dimensions: 0 x 0
Bedroom
- Level: First
- Dimensions: 0 x 0
Bedroom
- Level: First
- Dimensions: 0 x 0
Dining room
- Level: First
- Dimensions: 0 x 0
Living room
- Level: First
- Dimensions: 0 x 0
Features
- Other
- Has basement: No
- Number of fireplaces: 1
- Fireplace features: Masonry
Interior area
- Total interior livable area: 2,025 sqft
Video & virtual tour
Property
Parking
- Total spaces: 2
- Parking features: Other
- Attached garage spaces: 2
Features
- Levels: One
- Stories: 1
- Pool features: None
Lot
- Size: 10,323 Square Feet
Details
- Parcel number: 00249998
Construction
Type & style
- Home type: SingleFamily
- Architectural style: Detached
- Property subtype: Single Family Residence
Condition
- Year built: 1964
Utilities & green energy
- Sewer: Public Sewer
- Water: Public
- Utilities for property: Sewer Available, Water Available
Community & HOA
Community
- Subdivision: Boston Heights Add
HOA
- Has HOA: No
Location
- Region: Benbrook
Financial & listing details
- Price per square foot: $106/sqft
- Tax assessed value: $289,024
- Annual tax amount: $5,918
- Date on market: 5/29/2026
- Cumulative days on market: 19 days
Estimated market value
$208,100
$198,000 - $219,000
$2,183/mo
Price history
| Date | Event | Price |
|---|---|---|
| 6/18/2026 | Pending sale | $215,000$106/sqft |
Source: NTREIS #21285452 Report a problem | ||
| 6/12/2026 | Price change | $215,000-13.7%$106/sqft |
Source: NTREIS #21285452 Report a problem | ||
| 5/29/2026 | Listed for sale | $249,000+43.1%$123/sqft |
Source: NTREIS #21285452 Report a problem | ||
| 4/29/2019 | Listing removed | $174,000$86/sqft |
Source: Coldwell Banker Residential Brokerage - Fort Worth Tanglewood #13918236 Report a problem | ||
| 3/22/2019 | Price change | $174,000-2.2%$86/sqft |
Source: Virginia Cook, REALTORS #13918236 Report a problem | ||
| 2/26/2019 | Price change | $178,000-1.1%$88/sqft |
Source: Virginia Cook, REALTORS #13918236 Report a problem | ||
| 12/10/2018 | Price change | $180,000-5.3%$89/sqft |
Source: Virginia Cook, REALTORS #13918236 Report a problem | ||
| 10/24/2018 | Price change | $190,000-2.6%$94/sqft |
Source: Virginia Cook, REALTORS #13918236 Report a problem | ||
| 9/3/2018 | Price change | $195,000-1.8%$96/sqft |
Source: Virginia Cook, REALTORS #13918236 Report a problem | ||
| 8/21/2018 | Listed for sale | $198,500$98/sqft |
Source: Virginia Cook, REALTORS #13918236 Report a problem | ||
Public tax history
| Year | Property taxes | Tax assessment |
|---|---|---|
| 2025 | $4,241 -2% | $289,024 |
| 2024 | $4,326 +8.5% | $289,024 +3.6% |
| 2023 | $3,988 -18.4% | $278,973 +12.5% |
| 2022 | $4,888 -7% | $248,064 +20.1% |
| 2021 | $5,256 +11% | $206,583 +13% |
| 2020 | $4,734 +365.7% | $182,798 +82.2% |
| 2019 | $1,016 -12.5% | $100,353 -10.6% |
| 2018 | $1,162 +4.8% | $112,240 +4.7% |
| 2017 | $1,108 +9.8% | $107,203 +7.7% |
| 2016 | $1,009 -3.1% | $99,551 +12.7% |
| 2015 | $1,041 | $88,300 |
| 2014 | $1,041 | $88,300 |
| 2013 | -- | $88,300 -13% |
| 2012 | -- | $101,500 |
| 2011 | -- | $101,500 -0.3% |
| 2010 | -- | $101,800 -7.2% |
| 2009 | -- | $109,700 |
| 2008 | -- | $109,700 |
| 2007 | -- | $109,700 +5.5% |
| 2006 | -- | $104,000 |
| 2005 | -- | $104,000 -6.8% |
| 2004 | -- | $111,600 +6.4% |
| 2003 | -- | $104,900 +16.6% |
| 2002 | -- | $90,000 +1.8% |
| 2001 | -- | $88,400 +11.2% |
| 2000 | -- | $79,500 |
Find assessor info on the county website
Monthly payment
Est. payment$--/mo
Payment breakdown
Explore the cost of this home by adjusting the details. Changes won't be saved.All calculations are estimates and provided by Zillow, Inc. for informational purposes only. Actual amounts may vary.
HOA fees may include property taxes on listings classified as Co-Ops. Contact the listing agent and/or owner for fee details.
Mortgage interest rates are dependent on a number of factors, including credit score, down payment, and repayment length. Interest rate data provided by Zillow Group Marketplace, Inc. as of 1/1/1970 from various mortgage lenders with which we have lead or other similar arrangements; the Estimated Payment is an average of those rates.
See how much you could borrow to make a competitive offer.
Climate risks
Neighborhood: Boston Heights
Nearby schools
GreatSchools rating
- 5/10Waverly Park Elementary SchoolGrades: PK-5Distance: 0.7 mi
- 2/10Leonard Middle SchoolGrades: 6-8Distance: 1.1 mi
- 2/10Western Hills High SchoolGrades: 9-12Distance: 0.2 mi
Schools provided by the listing agent
- Elementary: Waverlypar
- Middle: Leonard
- High: Westn Hill
- District: Fort Worth ISD
Source: NTREIS. This data may not be complete. We recommend contacting the local school district to confirm school assignments for this home.
A local agent can set up tours, give advice and negotiate with sellers.
A local lender can help you make sure your offer is ready when you are.


- Texas
- Tarrant County
- Benbrook
- 76116
- Boston Heights
- 8012 Chapin Rd
Nearby cities
Nearby neighborhoods
Nearby zip codes
Other Benbrook Topics
