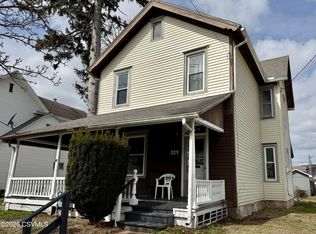
Nice Duplex with both apartments having 2 large bedrooms and a full bath. Separate utilities including central air, electric, water and gas heat paid by the tenant. Owner pays sewage only. Brand new metal roof was installed 2026. Large fenced in rear yard. Great income producing rental property.
Pending
Price cut: $6K (9/29)
$159,000
806 N Vine St, Berwick, PA 18603
4beds
2baths
2,080sqft
Multi Family
Built in 1900
-- sqft lot
$-- Zestimate®
$76/sqft
$-- HOA
What's special
Brand new metal roof
- 52 days
- 134
- 13
Zillow last checked:
Listing updated:
Listed by:
Rick I Bernstein 570-956-5823,
Benjamin Real Estate 570-788-4104,
Troy Topolski 570-956-1469,
Benjamin Real Estate
Source: Luzerne County AOR,MLS#: 26-4519
Facts & features
Interior
Bedrooms & bathrooms
- Bedrooms: 4
- Bathrooms: 2
Heating
- Natural Gas
Features
- Basement: Concrete,Full
Interior area
- Total structure area: 2,080
- Total interior livable area: 2,080 sqft
Property
Features
- Patio & porch: Deck, Patio
Lot
- Size: 7,456 Square Feet
- Dimensions: 46.6x160
Details
- Parcel number: 04B 0424600000
- Zoning: Residential
- Zoning description: Residential
Construction
Type & style
- Home type: MultiFamily
- Property subtype: Multi Family
Materials
- Aluminum Siding
- Roof: Metal
Condition
- Good
- New construction: No
- Year built: 1900
Utilities & green energy
- Sewer: Public Sewer
- Water: Public
Community & HOA
Location
- Region: Berwick
Financial & listing details
- Price per square foot: $76/sqft
- Tax assessed value: $42,885
- Annual tax amount: $1,997
- Date on market: 10/16/2026
Estimated market value
Not available
Estimated sales range
Not available
$1,144/mo
Price history
| Date | Event | Price |
|---|---|---|
| 10/18/2026 | Pending sale | $159,000$76/sqft |
Source: Luzerne County AOR #26-4519 Report a problem | ||
| 10/16/2026 | Listed for sale | $159,000$76/sqft |
Source: Luzerne County AOR #26-4519 Report a problem | ||
| 10/4/2026 | Pending sale | $159,000$76/sqft |
Source: Luzerne County AOR #26-4519 Report a problem | ||
| 9/29/2026 | Price change | $159,000-3.6%$76/sqft |
Source: Luzerne County AOR #26-4519 Report a problem | ||
| 9/14/2026 | Price change | $165,000-5.7%$79/sqft |
Source: Luzerne County AOR #26-4519 Report a problem | ||
| 9/3/2026 | Listed for sale | $175,000+113%$84/sqft |
Source: Luzerne County AOR #26-4519 Report a problem | ||
| 7/11/2019 | Sold | $82,150+4.6%$39/sqft |
Source: CSVBOR #20-78395 Report a problem | ||
| 2/27/2019 | Price change | $78,500-1.3%$38/sqft |
Source: CENTURY 21 Covered Bridges Realty, Inc. #20-78395 Report a problem | ||
| 1/3/2019 | Price change | $79,500-4.8%$38/sqft |
Source: CENTURY 21 Covered Bridges Realty, Inc. #20-78395 Report a problem | ||
| 11/9/2018 | Listed for sale | $83,500+68.7%$40/sqft |
Source: CENTURY 21 COVERED BRIDGES REALTY, INC. #20-78395 Report a problem | ||
| 5/30/2013 | Listing removed | $49,500+26.3%$24/sqft |
Source: CENTURY 21 Mertz & Associates, Inc. #20-53121 Report a problem | ||
| 5/6/2013 | Sold | $39,200-20.8%$19/sqft |
Source: CSVBOR #20-53121 Report a problem | ||
| 10/2/2012 | Listed for sale | $49,500$24/sqft |
Source: Danville Office #20-53121 Report a problem | ||
Public tax history
| Year | Property taxes | Tax assessment |
|---|---|---|
| 2025 | $1,954 +1.7% | $21,443 |
| 2024 | $1,922 +8.5% | $21,443 |
| 2023 | $1,772 +3.4% | $21,443 |
| 2022 | $1,714 | $21,443 |
| 2021 | $1,714 +4% | $21,443 |
| 2020 | $1,648 +2.2% | $21,443 |
| 2019 | $1,612 +4.1% | $21,443 |
| 2018 | $1,549 | $21,443 |
| 2017 | -- | $21,443 |
| 2016 | -- | $21,443 |
| 2015 | -- | $21,443 |
| 2014 | -- | $21,443 |
| 2013 | -- | $21,443 |
| 2012 | -- | $21,443 |
| 2011 | -- | $21,443 |
| 2010 | -- | $21,443 |
| 2009 | -- | $21,443 |
| 2008 | -- | $21,443 |
| 2007 | -- | $21,443 |
| 2006 | -- | $21,443 |
| 2005 | -- | $21,443 |
| 2004 | -- | $21,443 |
| 2003 | -- | $21,443 +0% |
| 2002 | -- | $21,442 |
| 2000 | -- | $21,442 |
Find assessor info on the county website
Monthly payment
Est. payment
Payment breakdown
Explore the cost of this home by adjusting the details. Changes won't be saved.Climate risks
Neighborhood: 18603

Similar homes
- $170,0003 bd2 ba1.4k sqft333 Lasalle St, Berwick, PA 18603For Sale
 MLS ID #C-2297, JESSE J WILLIAMS, EXP Realty, LLC. CSVBOR
- $168,0003 bd2 ba1.2k sqft1709 Chestnut St, Berwick, PA 18603For Sale
 MLS ID #C-2175, GERALDINE WOZNIAK, REALTY WORLD MASICH & DELL. CSVBOR
- $230,0005 bd2 ba2.2k sqft825 W Front St, Berwick, PA 18603For Sale
 MLS ID #26-4420, Jeffrey Shook, Button Real Estate. Luzerne County AOR
- $199,9003 bd2 ba1.6k sqft229 E 5th St, Berwick, PA 18603For Sale
 MLS ID #C-734, Philip Wayne Smith, ADVANCED REALTY SOLUTIONS LLC. CSVBOR
- $175,0002 bd2 ba1.2k sqft154 Hard Pan Rd, Shickshinny, PA 18655For Sale
 MLS ID #PALU2003362, Mr. Derek Greene, The Greene Realty Group. Bright MLS
- $124,9003 bd2 ba1.8k sqft597 Lily Lake Rd, Wapwallopen, PA 18660For Sale
 MLS ID #SC264564, Eliezer Arce, Christian Saunders Real Estate. GSBR as distributed by MLS GRID
- $152,9004 bd2 ba1.6k sqft13 N Gilbert St, Shenandoah, PA 17976For SaleMLS ID #PASK2029432, Jose Espinal Gil, Realty One Group Alliance. Bright MLS
- $139,9007 bd2 ba2.4k sqft215 N Jardin St, Shenandoah, PA 17976For SaleMLS ID #PASK2028098, Don Schwartz, EXP Realty, LLC. Bright MLS
