Step into 8233 Fair Way, a residence recently enhanced with a new roof and fresh interior paint throughout, establishing a clean and updated environment. The property includes a functional fireplace, while the kitchen provides a stylish accent backsplash. Enjoy relaxation from the covered patio, leading directly to a fully fenced in backyard. Experience updated comfort and outdoor appeal in this must-see residence. Included 100-Day Home Warranty with buyer activation
Active
Price cut: $16K (10/22)
$599,000
8233 Fair Way, Citrus Heights, CA 95610
3beds
2,123sqft
Single Family Residence
Built in 1953
0.5 Acres Lot
$613,600 Zestimate®
$282/sqft
$-- HOA
What's special
Functional fireplaceNew roofFresh interior paint throughoutStylish accent backsplashCovered patio
- 134 days
- 858
- 53
Zillow last checked:
Listing updated:
Listed by:
Lisa Soltesz DRE #02280080 480-462-5392,
Opendoor Brokerage Inc
Source: MetroList Services of CA,MLS#: 226072777Originating MLS: MetroList Services, Inc.
Facts & features
Interior
Bedrooms & bathrooms
- Bedrooms: 3
- Bathrooms: 2
- Full bathrooms: 2
Dining room
- Features: Other
Kitchen
- Features: Granite Counters
Heating
- Central, Natural Gas
Cooling
- Central Air
Appliances
- Laundry: Inside
Features
- Flooring: Carpet, Laminate, Tile, Wood
- Number of fireplaces: 1
- Fireplace features: Gas Log
Interior area
- Total interior livable area: 2,123 sqft
Property
Parking
- Total spaces: 2
- Parking features: Detached
- Garage spaces: 2
Lot
- Size: 0.5 Acres
- Features: Other
Details
- Parcel number: 21600700080000
- Zoning: RD2
- Special conditions: Standard
Construction
Type & style
- Home type: SingleFamily
- Property subtype: Single Family Residence
Materials
- Block, Stucco, Wood
- Foundation: Slab
- Roof: Composition
Condition
- Year built: 1953
Utilities & green energy
- Electric: See Remarks
- Sewer: Public Sewer
- Water: Public
- Utilities for property: Natural Gas Connected
Community & HOA
Location
- Region: Citrus Heights
Financial & listing details
- Price per square foot: $282/sqft
- Tax assessed value: $497,226
- Price range: $599K - $599K
- Date on market: 6/9/2026
Estimated market value
$613,600
$583,000 - $644,000
$2,354/mo
Price history
| Date | Event | Price |
|---|---|---|
| 10/22/2026 | Price change | $599,000-2.6%$282/sqft |
Source: MetroList Services of CA #226072777 Report a problem | ||
| 9/16/2026 | Listed for sale | $615,000$290/sqft |
Source: MetroList Services of CA #226072777 Report a problem | ||
| 8/11/2026 | Listing removed | $615,000$290/sqft |
Source: MetroList Services of CA #226072777 Report a problem | ||
| 7/30/2026 | Price change | $615,000-0.8%$290/sqft |
Source: MetroList Services of CA #226072777 Report a problem | ||
| 7/16/2026 | Price change | $620,000-1.6%$292/sqft |
Source: MetroList Services of CA #226072777 Report a problem | ||
| 6/9/2026 | Listed for sale | $630,000+1.5%$297/sqft |
Source: MetroList Services of CA #226072777 Report a problem | ||
| 4/22/2026 | Sold | $620,500+42%$292/sqft |
Source: Public Record Report a problem | ||
| 9/27/2018 | Sold | $437,000$206/sqft |
Source: MetroList Services of CA #18048771 Report a problem | ||
| 8/14/2018 | Pending sale | $437,000$206/sqft |
Source: Advanced Global Real Estate #18048771 Report a problem | ||
| 7/19/2018 | Listed for sale | $437,000+112.1%$206/sqft |
Source: Advanced Global Real Estate #18048771 Report a problem | ||
| 9/8/2010 | Sold | $206,000+47.1%$97/sqft |
Source: MetroList Services of CA #10057335 Report a problem | ||
| 3/26/2010 | Sold | $140,000+106770.2%$66/sqft |
Source: Public Record Report a problem | ||
| 9/24/2002 | Sold | $131 |
Source: Public Record Report a problem | ||
Public tax history
| Year | Property taxes | Tax assessment |
|---|---|---|
| 2026 | -- | $497,226 +2% |
| 2025 | $5,818 +0.9% | $487,478 +2% |
| 2024 | $5,763 +2.6% | $477,921 +2% |
| 2023 | $5,617 +0.5% | $468,551 +2% |
| 2022 | $5,588 +1.7% | $459,364 +2% |
| 2021 | $5,496 +1.9% | $450,357 +1% |
| 2020 | $5,393 +2% | $445,740 +2% |
| 2019 | $5,285 +73.6% | $437,000 +70.9% |
| 2018 | $3,045 +1% | $255,650 +2% |
| 2017 | $3,014 +7.1% | $250,639 +2% |
| 2016 | $2,815 +4% | $245,725 +1.5% |
| 2015 | $2,707 | $242,035 +2% |
| 2014 | $2,707 | $237,294 +1.7% |
| 2013 | -- | $233,322 +11% |
| 2012 | -- | $210,120 +35.5% |
| 2011 | -- | $155,048 +0.8% |
| 2010 | -- | $153,891 -15.3% |
| 2008 | -- | $181,777 +2% |
| 2007 | -- | $178,214 +2% |
| 2006 | -- | $174,720 +37.4% |
| 2005 | -- | $127,178 +2% |
| 2004 | -- | $124,685 +40.2% |
| 2003 | -- | $88,909 +2% |
| 2002 | -- | $87,167 +2% |
| 2001 | -- | $85,459 +2% |
| 2000 | -- | $83,784 |
Find assessor info on the county website
Monthly payment
Est. payment
Payment breakdown
Explore the cost of this home by adjusting the details. Changes won't be saved.Climate risks
Neighborhood: Sunrise Ranch


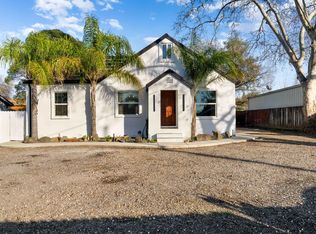
Similar homes
- $505,0003 bd2 ba1.5k sqft7931 Mariposa Ave, Citrus Heights, CA 95610For Sale
 MLS ID #225082957, Pierce Plam. MetroList Services of CA
- $533,0003 bd3 ba1.8k sqft8092 Alma Mesa Way, Citrus Heights, CA 95610For Sale
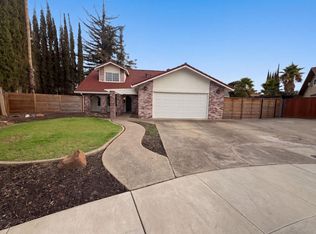 MLS ID #226108947, Lisa Soltesz. MetroList Services of CA
- $507,0003 bd3 ba1.3k sqft8266 Streng Ave, Citrus Heights, CA 95610For Sale
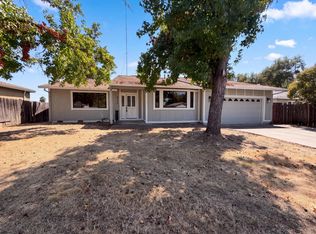 MLS ID #226102398, Lisa Soltesz. MetroList Services of CA
- $439,0003 bd2 ba1.1k sqft7372 Black Oaks Way, Citrus Heights, CA 95621For Sale
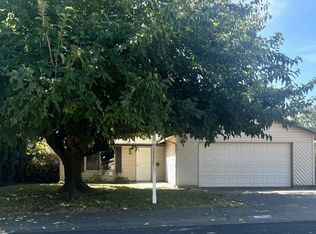 MLS ID #226129814, Kallie Orr Orr. MetroList Services of CA
