Welcome home to Dearborn Heights! This 3 bedroom, 1 bath home has everything you need. Open floor plan, with spacious bedrooms featuring lots of storage. Open and airy kitchen gives you plenty of space for all your tools and gadgets, and the fenced in double lot ensures your privacy. Schedule your showing today!
For sale
$200,000
8280 Fenton St, Dearborn Heights, MI 48127
3beds
954sqft
Single Family Residence
Built in 1937
0.27 Acres Lot
$188,200 Zestimate®
$210/sqft
$-- HOA
What's special
- 34 days
- 229
- 16
Zillow last checked:
Listing updated:
Listed by:
Sam Bazzi 248-600-7000,
Pro Realty Group 313-722-4484
Source: Realcomp II,MLS#: 20261076798
Facts & features
Interior
Bedrooms & bathrooms
- Bedrooms: 3
- Bathrooms: 1
- Full bathrooms: 1
Bedroom
- Level: Entry
- Area: 100
- Dimensions: 10 X 10
Bedroom
- Level: Entry
- Area: 100
- Dimensions: 10 X 10
Bedroom
- Level: Entry
- Area: 120
- Dimensions: 12 X 10
Other
- Level: Entry
Heating
- Forced Air, Natural Gas
Features
- Has basement: No
- Has fireplace: No
Interior area
- Total interior livable area: 954 sqft
- Finished area above ground: 954
Property
Parking
- Total spaces: 1
- Parking features: One Car Garage, Detached
- Garage spaces: 1
Features
- Levels: One
- Stories: 1
- Entry location: GroundLevelwSteps
- Pool features: None
Lot
- Size: 0.27 Acres
- Dimensions: 80 x 145
Details
- Parcel number: 33003030257300
- Special conditions: Short Sale No,Standard
Construction
Type & style
- Home type: SingleFamily
- Architectural style: Ranch
- Property subtype: Single Family Residence
Materials
- Vinyl Siding
- Foundation: Crawl Space
Condition
- New construction: No
- Year built: 1937
Utilities & green energy
- Sewer: Public Sewer
- Water: Public
Community & HOA
Community
- Subdivision: GREATER DETROIT NEW CITY PARK SUB
HOA
- Has HOA: No
Location
- Region: Dearborn Heights
Financial & listing details
- Price per square foot: $210/sqft
- Tax assessed value: $70,000
- Annual tax amount: $2,587
- Date on market: 9/23/2026
- Cumulative days on market: 34 days
- Listing agreement: Exclusive Right To Sell
- Listing terms: Cash,Conventional,FHA
Estimated market value
$188,200
$179,000 - $198,000
$1,582/mo
Price history
| Date | Event | Price |
|---|---|---|
| 9/23/2026 | Listed for sale | $200,000+42.9%$210/sqft |
Source:  Realcomp II #20261076798 Report a problem | ||
| 3/3/2025 | Sold | $140,000-12.5%$147/sqft |
Source: Realcomp II #20250003934 Report a problem | ||
| 1/28/2025 | Pending sale | $160,000$168/sqft |
Source: Realcomp II #20250003934 Report a problem | ||
| 1/17/2025 | Listed for sale | $160,000+14.4%$168/sqft |
Source: Realcomp II #20250003934 Report a problem | ||
| 8/15/2023 | Listing removed | -- |
Source: Realcomp II #20230038038 Report a problem | ||
| 6/20/2023 | Listed for sale | $139,900$147/sqft |
Source: Realcomp II #20230038038 Report a problem | ||
| 6/15/2023 | Pending sale | $139,900$147/sqft |
Source: Realcomp II #20230038038 Report a problem | ||
| 5/16/2023 | Listed for sale | $139,900$147/sqft |
Source: Realcomp II #20230038038 Report a problem | ||
| 3/2/2022 | Listing removed | -- |
Source: Realcomp II #2220004902 Report a problem | ||
| 1/24/2022 | Listed for sale | $139,900+0.6%$147/sqft |
Source: Realcomp II #2220004902 Report a problem | ||
| 7/31/2020 | Listing removed | $139,000$146/sqft |
Source: Century 21 Curran & Oberski #2200048654 Report a problem | ||
| 6/27/2020 | Listed for sale | $139,000+107.5%$146/sqft |
Source: Century 21 Curran & Oberski #2200048654 Report a problem | ||
| 4/11/2016 | Sold | $67,000-11.8%$70/sqft |
Source: Public Record Report a problem | ||
| 11/18/2015 | Listing removed | $76,000$80/sqft |
Source: Keller Williams Rlty Northville Mkt Ctr #215082913 Report a problem | ||
| 9/2/2015 | Price change | $76,000-5%$80/sqft |
Source: Keller Williams Rlty Northville Mkt Ctr #215082913 Report a problem | ||
| 8/4/2015 | Listed for sale | $80,000+25%$84/sqft |
Source: Keller Williams Rlty Northville Mkt Ctr #215082913 Report a problem | ||
| 8/6/1996 | Sold | $64,000$67/sqft |
Source: Public Record Report a problem | ||
Public tax history
| Year | Property taxes | Tax assessment |
|---|---|---|
| 2025 | -- | $79,300 +15.8% |
| 2024 | -- | $68,500 +12.1% |
| 2023 | -- | $61,100 +7% |
| 2022 | -- | $57,100 +10% |
| 2021 | -- | $51,900 |
| 2020 | $2,871 +30.5% | $51,900 +7.5% |
| 2019 | $2,200 | $48,300 +20.4% |
| 2018 | $2,200 | $40,100 +2.6% |
| 2017 | -- | $39,100 +8% |
| 2016 | $1,428 | $36,200 +7.4% |
| 2015 | $1,428 -54.8% | $33,700 +6.6% |
| 2013 | $3,160 +121.3% | $31,600 -21.4% |
| 2010 | $1,428 | $40,200 -26.1% |
| 2008 | -- | $54,400 -1.3% |
| 2006 | $778 -32.7% | $55,100 +13.4% |
| 2005 | $1,156 +5.4% | $48,600 +8.2% |
| 2003 | $1,096 +4.4% | $44,900 +66.4% |
| 2001 | $1,050 +10.4% | $26,991 +3.2% |
| 2000 | $951 | $26,155 |
Find assessor info on the county website
Monthly payment
Est. payment
Payment breakdown
Explore the cost of this home by adjusting the details. Changes won't be saved.Climate risks
Neighborhood: 48127
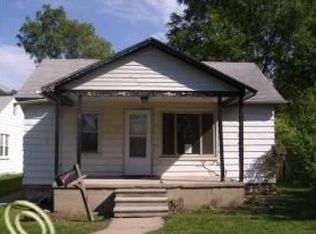
- $130,2003 bd1 ba928 sqft8270 Fenton St, Dearborn Heights, MI 48127Off Market
- $276,3004 bd2 ba2.3k sqft8298 Fenton St, Dearborn Heights, MI 48127Off Market
- $16,200-- bd-- ba-- sqft8252 Fenton St, Dearborn Heights, MI 48127Off Market
- $136,9002 bd1 ba836 sqft8308 Fenton St, Dearborn Heights, MI 48127Off Market
Similar homes
- $195,0004 bd2 ba1.4k sqft5918 Cardwell St, Garden City, MI 48135For Sale

 MLS ID #20261028243, Steve Koleno, Beycome Brokerage Realty LLC. Realcomp II
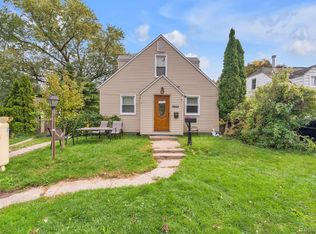
- $279,9994 bd1 ba1.3k sqft5664 Fenton St, Dearborn Heights, MI 48127For Sale
 MLS ID #20261081224, Michael M Phillips, Keller Williams Legacy. Realcomp II
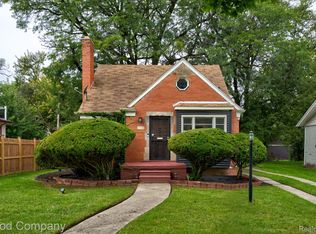
- $190,0003 bd1 ba1k sqft13935 Rutland St, Detroit, MI 48227For Sale
 MLS ID #20261075381, Jim Shaffer, Good Company. Realcomp II
- $199,9993 bd2 ba1.3k sqft18849 Delaware Ave, Redford, MI 48240For Sale
 MLS ID #20261077739, James R Parker, Pearl Real Estate. Realcomp II
- $189,9002 bd1 ba848 sqft2129 Geneva St, Dearborn, MI 48124For SaleMLS ID #20261067498, Michael M Phillips, Keller Williams Legacy. Realcomp II
- $194,9004 bd2 ba1.4k sqft5424 Bingham St, Dearborn, MI 48126For SaleMLS ID #20261033589, Mohammed Aljibory, Tanana Realty Group LLC. Realcomp II
- $179,0004 bd2 ba1.2k sqft12072 Rockland, Redford, MI 48239For SaleMLS ID #20261039063, Leann Bleckley, The Agency of Gateway. Realcomp II
- $200,0003 bd1 ba1.1k sqft7739 Rosedale Blvd, Allen Park, MI 48101For SaleMLS ID #20261078032, Hassan Makhzoum, Keller Williams Legacy. Realcomp II
- $224,9003 bd2 ba1.1k sqft24805 Midland Ave, Redford, MI 48239For Sale
 MLS ID #50224010, Kevin P. Brennan, Sine & Monaghan LLC. MiRealSource
- $135,0002 bd1 ba988 sqft1601 Helen St, Inkster, MI 48141For SaleMLS ID #20261085785, Daniel Beirne, OpenDoor Brokerage LLC. Realcomp II
- $174,9003 bd2 ba1.2k sqft20620 Westhampton Ave, Southfield, MI 48075For SaleMLS ID #50221932, Eric Crayton, 21 United. MiRealSource
- $169,9003 bd2 ba910 sqft26630 Dartmouth St, Inkster, MI 48141For SaleMLS ID #50220054, Penny L Tarwacki, Real Estate One Southgate. MiRealSource
- $198,9003 bd2 ba1.2k sqft4215 Duplex Ave, Lincoln Park, MI 48146For SaleMLS ID #20261084458, Ron Anderson Jr, Remirus. Realcomp II
- $265,0002 bd1 ba840 sqft20980 Van Buren St, Southfield, MI 48033For SaleMLS ID #20261085767, Bianca Lopez, Remerica United Realty. Realcomp II
- $150,0003 bd1 ba1.3k sqft15482 Winston, Redford, MI 48239For SaleMLS ID #20261078536, Ahmed Gharib, Keller Williams Legacy. Realcomp II
- $209,0003 bd1 ba1.1k sqft16915 W Twelve Mile Rd, Southfield, MI 48076For Sale
 MLS ID #26050620, David Bobr, National Realty Centers. MichRIC
- $240,0003 bd1 ba1.1k sqft32612 Dover St, Garden City, MI 48135For SaleMLS ID #20261078085, C Noel Derr, Century 21 Dynamic Realty. Realcomp II
- $220,0003 bd2 ba1.3k sqft15212 Orchard Ct, Romulus, MI 48174For SaleMLS ID #26051110, Woody Willis, 3DX Real Estate, LLC. MichRIC
- $200,0002 bd2 ba981 sqft34627 Nancy St, Westland, MI 48186For SaleMLS ID #50202779, Mandee Wells, Real Estate One Monroe. MiRealSource
- $183,0004 bd1 ba1.3k sqft22327 Wick Rd, Taylor, MI 48180For SaleMLS ID #20261066060, Brandi Griffin, Irongate Realty Group. Realcomp II
