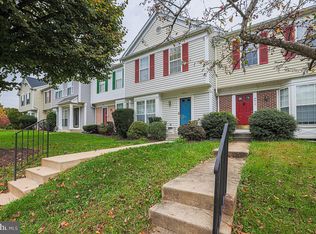
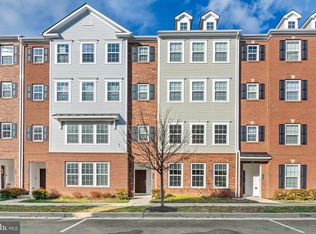
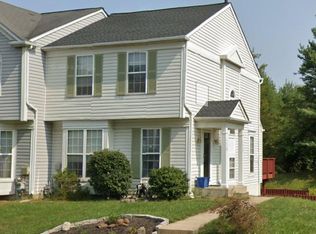
$299,800
-- bd2 ba1.3k sqft
7 Samantha Ct, Owings Mills, MD 21117
Off Market
Zillow last checked:
Listing updated:
NIKITA LAWS 410-415-3058,
Berkshire Hathaway HomeServices Homesale Realty (800) 383-3535,
Co-Listing Agent: Debbie K Reynolds 410-365-9625,
Berkshire Hathaway HomeServices Homesale Realty

$339,500
$323,000 - $356,000
$2,347/mo
| Date | Event | Price |
|---|---|---|
| 11/20/2026 | Listed for sale | $340,000+58.1%$187/sqft |
Source:  Bright MLS #MDBC2181340 Report a problem | ||
| 8/21/2026 | Sold | $215,000+62.3%$119/sqft |
Source: Public Record Report a problem | ||
| 7/18/2013 | Listing removed | $1,750$1/sqft |
Source: Go Section8 Report a problem | ||
| 6/20/2013 | Price change | $1,750+9.4%$1/sqft |
Source: Go Section8 Report a problem | ||
| 5/24/2013 | Listed for rent | $1,600$1/sqft |
Source: Go Section8 Report a problem | ||
| 8/16/2011 | Sold | $132,500-38.4%$73/sqft |
Source: Public Record Report a problem | ||
| 8/12/2010 | Sold | $215,003-15.7%$119/sqft |
Source: Public Record Report a problem | ||
| 5/3/2006 | Sold | $255,000+129.9%$141/sqft |
Source: Public Record Report a problem | ||
| 3/30/2001 | Sold | $110,900+3.2%$61/sqft |
Source: Public Record Report a problem | ||
| 10/6/1993 | Sold | $107,490$59/sqft |
Source: Public Record Report a problem | ||
| Year | Property taxes | Tax assessment |
|---|---|---|
| 2026 | $3,686 +7.7% | $254,633 +8.1% |
| 2025 | $3,423 +30.4% | $235,567 +8.8% |
| 2024 | $2,624 +2.5% | $216,500 +2.5% |
| 2023 | $2,560 +2.6% | $211,233 -2.4% |
| 2022 | $2,496 +2.6% | $216,500 +7.9% |
| 2021 | $2,432 +2.6% | $200,700 +2.6% |
| 2020 | $2,371 +2.7% | $195,600 -2.5% |
| 2019 | $2,309 +2.8% | $200,700 +8.3% |
| 2018 | $2,247 +3.1% | $185,400 +3.1% |
| 2017 | $2,179 -24% | $179,767 +3.2% |
| 2016 | $2,868 | $174,133 +3.3% |
| 2015 | $2,868 | $168,500 |
| 2014 | $2,868 | $168,500 |
| 2013 | -- | $168,500 -19.1% |
| 2012 | -- | $208,300 |
| 2011 | -- | $208,300 |
| 2010 | -- | $208,300 -15.2% |
| 2009 | -- | $245,600 +19.6% |
| 2008 | -- | $205,272 +24.4% |
| 2007 | -- | $164,946 +32.4% |
| 2006 | -- | $124,620 +4.8% |
| 2005 | -- | $118,926 +5% |
| 2004 | -- | $113,233 +5.3% |
| 2003 | -- | $107,540 +0.9% |
| 2002 | -- | $106,536 +1% |
| 2001 | -- | $105,533 |
Source: Bright MLS. This data may not be complete. We recommend contacting the local school district to confirm school assignments for this home.
A local agent can set up tours, give advice and negotiate with sellers.