Craftsman. 1450 sq.ft +Aprx. 1000sq,ft semi-finished basement. Large lot, Quiet street, close to everything.
For sale by owner
$541,000
910 Newell St, Bellingham, WA 98225
5beds
1baths
1,450sqft
Single Family Residence
Built in 1904
6,969 Square Feet Lot
$-- Zestimate®
$373/sqft
$-- HOA
What's special
Large lot
- 16 hours
- 192
- 0
Zillow last checked:
Listed by:
Property Owner (360) 781-9116
Source: FSBO-Online.com
This property is for sale by owner and Zillow, Inc. is displaying it at the owner's request. It is not subject to a listing agreement with Zillow, Inc. or its affiliates.Facts & features
Interior
Bedrooms & bathrooms
- Bedrooms: 5
- Bathrooms: 1
Interior area
- Total structure area: 1,450
- Total interior livable area: 1,450 sqft
Property
Lot
- Size: 6,969 Square Feet
Details
- Parcel number: 3803313592440000
Construction
Type & style
- Home type: SingleFamily
- Property subtype: Single Family Residence
Condition
- Year built: 1904
Community & HOA
HOA
- Services included: HOA
Location
- Region: Bellingham
Financial & listing details
- Price per square foot: $373/sqft
- Tax assessed value: $576,712
- Annual tax amount: $910
- Date on market: 11/18/2026
- Lease term: Contact For Details
Estimated market value
Not available
Estimated sales range
Not available
$3,340/mo
Price history
| Date | Event | Price |
|---|---|---|
| 11/18/2026 | Listed for sale | $541,000$373/sqft |
Source: FSBO-Online.com Report a problem | ||
| 10/9/2026 | Listing removed | $541,000$373/sqft |
Source: FSBO-Online.com Report a problem | ||
| 10/1/2026 | Price change | $541,000-12%$373/sqft |
Source: FSBO-Online.com Report a problem | ||
| 8/1/2026 | Listed for sale | $615,000-1.4%$424/sqft |
Source: FSBO-Online.com Report a problem | ||
| 2/7/2026 | Listing removed | $624,000$430/sqft |
Source: FSBO-Online.com Report a problem | ||
| 11/11/2025 | Listed for sale | $624,000$430/sqft |
Source: FSBO-Online.com Report a problem | ||
| 9/20/2025 | Listing removed | $624,000$430/sqft |
Source: FSBO-Online.com Report a problem | ||
| 9/11/2025 | Listed for sale | $624,000$430/sqft |
Source: FSBO-Online.com Report a problem | ||
| 7/23/2025 | Listing removed | $624,000$430/sqft |
Source: FSBO-Online.com Report a problem | ||
| 6/20/2025 | Listed for sale | $624,000$430/sqft |
Source: FSBO-Online.com Report a problem | ||
| 5/31/2025 | Listing removed | $624,000$430/sqft |
Source: FSBO-Online.com Report a problem | ||
| 5/7/2025 | Listed for sale | $624,000$430/sqft |
Source: FSBO-Online.com Report a problem | ||
| 4/18/2025 | Listing removed | $624,000$430/sqft |
Source: FSBO-Online.com Report a problem | ||
| 3/26/2025 | Price change | $624,000+8.7%$430/sqft |
Source: FSBO-Online.com Report a problem | ||
| 3/2/2025 | Listed for sale | $574,000$396/sqft |
Source: FSBO-Online.com Report a problem | ||
| 1/25/2025 | Listing removed | $574,000$396/sqft |
Source: FSBO-Online.com Report a problem | ||
| 12/20/2024 | Listed for sale | $574,000-9%$396/sqft |
Source: FSBO-Online.com Report a problem | ||
| 11/18/2024 | Listing removed | -- |
Source: FSBO-Online.com Report a problem | ||
| 7/5/2024 | Listing removed | -- |
Source: FSBO-Online.com Report a problem | ||
| 5/18/2024 | Price change | $631,000+2.8%$435/sqft |
Source: FSBO-Online.com Report a problem | ||
| 4/6/2024 | Listed for sale | $614,000-1.1%$423/sqft |
Source: FSBO-Online.com Report a problem | ||
| 12/25/2023 | Listing removed | -- |
Source: FSBO-Online.com Report a problem | ||
| 12/22/2023 | Listed for sale | $621,000$428/sqft |
Source: FSBO-Online.com Report a problem | ||
| 12/8/2023 | Listing removed | -- |
Source: FSBO-Online.com Report a problem | ||
| 12/3/2023 | Listed for sale | $621,000$428/sqft |
Source: FSBO-Online.com Report a problem | ||
Public tax history
| Year | Property taxes | Tax assessment |
|---|---|---|
| 2025 | $910 -80.1% | $576,712 +3% |
| 2024 | $4,584 +2.6% | $559,922 -2.5% |
| 2023 | $4,469 +8.6% | $574,178 +18% |
| 2022 | $4,117 +16.6% | $486,601 +28% |
| 2021 | $3,531 +1.9% | $380,157 +8% |
| 2020 | $3,464 | $351,997 +3.5% |
| 2019 | $3,464 +2364.8% | $340,242 +5.9% |
| 2018 | $141 -5.9% | $321,383 +16.1% |
| 2017 | $149 -5.7% | $276,723 +9.9% |
| 2016 | $158 -5% | $251,795 +7.3% |
| 2015 | $167 | $234,769 +3.1% |
| 2014 | $167 -4.2% | $227,710 +6.8% |
| 2013 | $174 | $213,280 +2.9% |
| 2012 | -- | $207,218 |
| 2011 | -- | -- |
| 2010 | -- | -- |
| 2009 | $153 -8.3% | $85,580 |
| 2008 | $167 | $85,580 -45.3% |
| 2007 | $167 | $156,570 +83% |
| 2005 | -- | $85,580 |
| 2004 | $201 -46.6% | $85,580 |
| 2003 | $377 -70.2% | $85,580 -20.4% |
| 2002 | $1,265 +364.8% | $107,465 +25.6% |
| 2001 | $272 | $85,580 |
| 2000 | -- | $85,580 |
| 1999 | -- | $85,580 |
Find assessor info on the county website
Monthly payment
Est. payment
Payment breakdown
Explore the cost of this home by adjusting the details. Changes won't be saved.Climate risks
Neighborhood: Sehome
Similar homes
- $549,9003 bd1 ba1.1k sqftPerkins Sub, Bellingham, WA 98225Active
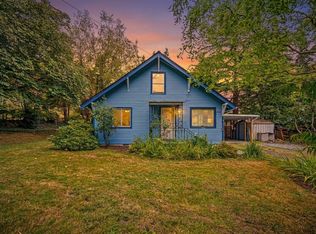 MLS ID #2580001, Jessica Noonan. NWMLS as distributed by MLS GRID
- $449,0004 bd2 ba1.2k sqftNew Whatcom, Bellingham, WA 98225Active
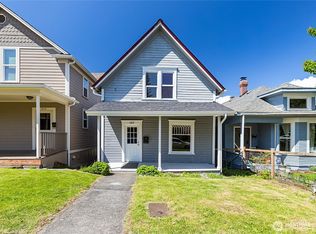 MLS ID #2553082, Damian Pro. NWMLS as distributed by MLS GRID
- $650,0005 bd1 ba1.7k sqft1901 Harris Avenue, Bellingham, WA 98225Active
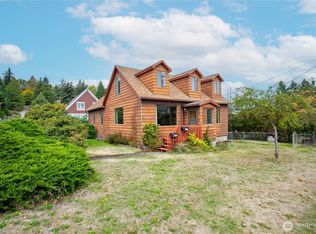 MLS ID #2590138, Holly Tremaine-Swanson. NWMLS as distributed by MLS GRID
- $518,7003 bd2 ba1.1k sqft3015 Birchwood Avenue, Bellingham, WA 98225Active
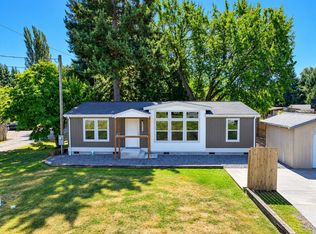 MLS ID #2602003, David Harmon. NWMLS as distributed by MLS GRID
