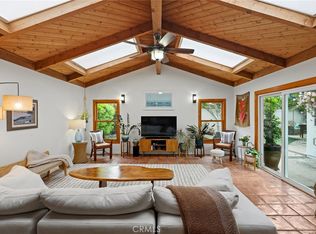
This 1842 square foot single family home has 4 bedrooms and 2.0 bathrooms. This home is located at 921 Topsail Ct, Oxnard, CA 93035.
Pre-foreclosure
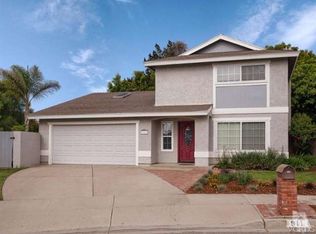
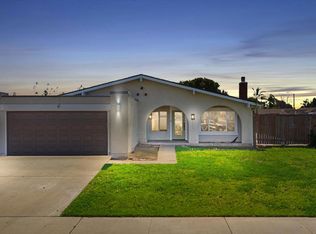
Street View
Est. $876,300
921 Topsail Ct, Oxnard, CA 93035
4beds
2baths
1,842sqft
SingleFamily
Built in 1975
7,405 Square Feet Lot
$876,300 Zestimate®
$476/sqft
$-- HOA
Overview
- 368 days |
- 19 |
- 0 |
Facts & features
Interior
Bedrooms & bathrooms
- Bedrooms: 4
- Bathrooms: 2
Features
- Has fireplace: Yes
Interior area
- Total interior livable area: 1,842 sqft
Property
Parking
- Parking features: Garage - Attached
Lot
- Size: 7,405 Square Feet
Details
- Parcel number: 1850022285
Construction
Type & style
- Home type: SingleFamily
Condition
- Year built: 1975
Community & HOA
Location
- Region: Oxnard
Financial & listing details
- Price per square foot: $476/sqft
- Tax assessed value: $554,482
- Annual tax amount: $6,887
Visit our professional directory to find a foreclosure specialist in your area that can help with your home search.
Find a foreclosure agentForeclosure details
Estimated market value
$876,300
$824,000 - $929,000
$4,040/mo
Price history
| Date | Event | Price |
|---|---|---|
| 7/21/2003 | Sold | $350,000+12.9%$190/sqft |
Source: Public Record Report a problem | ||
| 4/26/2002 | Sold | $310,000+13.2%$168/sqft |
Source: Public Record Report a problem | ||
| 8/16/1995 | Sold | $273,909+55.6%$149/sqft |
Source: Public Record Report a problem | ||
| 5/22/1995 | Sold | $176,000$96/sqft |
Source: Public Record Report a problem | ||
Public tax history
| Year | Property taxes | Tax assessment |
|---|---|---|
| 2025 | $6,887 +6.1% | $554,482 +2% |
| 2024 | $6,493 | $543,610 +2% |
| 2023 | $6,493 +3.1% | $532,951 +2% |
| 2022 | $6,298 +0.8% | $522,501 +2% |
| 2021 | $6,248 -1.8% | $512,256 +1% |
| 2020 | $6,364 +2.9% | $507,004 +2% |
| 2019 | $6,185 +1.4% | $497,064 +2% |
| 2018 | $6,098 +5.4% | $487,318 +2% |
| 2017 | $5,788 +3.6% | $477,764 +2% |
| 2016 | $5,586 -1% | $468,398 +1.5% |
| 2015 | $5,645 +13.9% | $461,364 +15.1% |
| 2014 | $4,956 | $401,000 +10.2% |
| 2013 | -- | $364,000 +13.8% |
| 2012 | -- | $320,000 -12.1% |
| 2011 | -- | $364,000 +2.5% |
| 2009 | -- | $355,000 -14.2% |
| 2007 | -- | $413,870 +2% |
| 2006 | -- | $405,756 +2% |
| 2005 | -- | $397,800 +25.8% |
| 2003 | -- | $316,200 +53.7% |
| 2002 | -- | $205,766 +2% |
| 2001 | $2,480 +4.6% | $201,733 +2% |
| 2000 | $2,370 | $197,778 |
Find assessor info on the county website
Monthly payment
Estimated monthly payment$1,822
All calculations are estimates and provided by Zillow, Inc. for informational purposes only. Actual amounts may vary.
HOA fees may include property taxes on listings classified as Co-Ops. Contact the listing agent and/or owner for fee details.
Mortgage interest rates are dependent on a number of factors, including credit score, down payment, and repayment length. Interest rate data provided by Zillow Group Marketplace, Inc. as of 1/1/1970 from various mortgage lenders with which we have lead or other similar arrangements; the Estimated Payment is an average of those rates.
See how much you could borrow to make a competitive offer.
Climate risks
Neighborhood: Sea View Estates
Nearby schools
GreatSchools rating
- 5/10Juan Lagunas Soria Elementary SchoolGrades: K-8Distance: 0.5 mi
- 5/10Oxnard High SchoolGrades: 9-12Distance: 1.7 mi
- 3/10Fremont Academy of Environmental Science & Innovative DesignGrades: 6-8Distance: 2.1 mi

- California
- Ventura County
- Oxnard
- 93035
- Sea View Estates
- 921 Topsail Ct
Nearby cities
Nearby neighborhoods
Nearby zip codes
Other Oxnard Topics
