Vacant!!! Ready to move in!!! Locate in a nice neighborhood ,close to shopping and highway.
Active
$305,000
9366 THUNDERBOLT Drive, Jacksonville, FL 32221
3beds
1,932sqft
Single Family Residence
Built in 2004
6,969 Square Feet Lot
$303,700 Zestimate®
$158/sqft
$31/mo HOA
What's special
- 5 days
- 205
- 7
Likely to sell faster than
Zillow last checked:
Listing updated:
Listed by:
TINA ANH PHAM 904-305-7767,
GOLDEN PEN REALTY LLC 904-305-7767,
BEN HAWKINS 904-760-2717
Source: realMLS,MLS#: 2173052
Facts & features
Interior
Bedrooms & bathrooms
- Bedrooms: 3
- Bathrooms: 2
- Full bathrooms: 2
Heating
- Central, Electric
Cooling
- Central Air, Electric
Appliances
- Included: Dishwasher, Refrigerator
- Laundry: Electric Dryer Hookup
Features
- Ceiling Fan(s)
- Flooring: Laminate, Wood
Interior area
- Total interior livable area: 1,932 sqft
Property
Parking
- Total spaces: 2
- Parking features: Attached, Garage
- Attached garage spaces: 2
Features
- Levels: One
- Stories: 1
- Fencing: Fenced,Back Yard
Lot
- Size: 6,969 Square Feet
Details
- Parcel number: 0090623945
- Zoning description: Residential
Construction
Type & style
- Home type: SingleFamily
- Architectural style: Traditional
- Property subtype: Single Family Residence
Materials
- Roof: Shingle
Condition
- New construction: No
- Year built: 2004
Utilities & green energy
- Sewer: Public Sewer
- Water: Public
- Utilities for property: Electricity Connected, Water Connected
Community & HOA
Community
- Subdivision: Pinecrest
HOA
- Has HOA: Yes
- HOA fee: $375 annually
Location
- Region: Jacksonville
Financial & listing details
- Price per square foot: $158/sqft
- Tax assessed value: $239,547
- Annual tax amount: $4,615
- Date on market: 11/10/2026
- Listing terms: Cash,Conventional,FHA,VA Loan
- Road surface type: Asphalt
Estimated market value
$303,700
$289,000 - $319,000
$1,883/mo
Price history
| Date | Event | Price |
|---|---|---|
| 11/10/2026 | Listed for sale | $305,000+1.7%$158/sqft |
Source:  realMLS #2173052 Report a problem | ||
| 9/23/2026 | Listed for rent | $1,875$1/sqft |
Source: Zillow Rentals Report a problem | ||
| 8/6/2026 | Listing removed | $300,000$155/sqft |
Source: realMLS #2123289 Report a problem | ||
| 4/23/2026 | Price change | $300,000-7.7%$155/sqft |
Source: realMLS #2123289 Report a problem | ||
| 1/16/2026 | Price change | $325,000-5.8%$168/sqft |
Source: realMLS #2123289 Report a problem | ||
| 1/2/2026 | Listed for sale | $345,000+11.3%$179/sqft |
Source: realMLS #2123289 Report a problem | ||
| 4/18/2023 | Sold | $310,000-2.4%$160/sqft |
Source: realMLS #1197509 Report a problem | ||
| 4/11/2023 | Pending sale | $317,500$164/sqft |
Source: realMLS #1197509 Report a problem | ||
| 2/27/2023 | Listed for sale | $317,500$164/sqft |
Source: realMLS #1197509 Report a problem | ||
| 1/30/2023 | Listing removed | -- |
Source: realMLS #1197509 Report a problem | ||
| 1/13/2023 | Price change | $317,500-2.3%$164/sqft |
Source: realMLS #1197509 Report a problem | ||
| 11/23/2022 | Price change | $325,000-1.5%$168/sqft |
Source: realMLS #1197509 Report a problem | ||
| 11/4/2022 | Price change | $330,000-2.9%$171/sqft |
Source: realMLS #1197509 Report a problem | ||
| 10/24/2022 | Listed for sale | $340,000+167.7%$176/sqft |
Source: realMLS #1197509 Report a problem | ||
| 4/3/2013 | Sold | $127,000-3%$66/sqft |
Source: Public Record Report a problem | ||
| 6/22/2004 | Sold | $130,900$68/sqft |
Source: Public Record Report a problem | ||
Public tax history
| Year | Property taxes | Tax assessment |
|---|---|---|
| 2025 | $4,616 +1.4% | $239,547 -1.8% |
| 2024 | $4,554 +182.6% | $244,052 +103.4% |
| 2023 | $1,611 +10.1% | $119,982 +3% |
| 2022 | $1,463 +1.4% | $116,488 +3% |
| 2021 | $1,443 +1.3% | $113,096 +1.4% |
| 2020 | $1,425 +1.6% | $111,535 +2.3% |
| 2019 | $1,402 +1.7% | $109,028 +1.9% |
| 2018 | $1,378 | $106,996 +2.1% |
| 2017 | $1,378 +1.7% | $104,796 +2.1% |
| 2016 | $1,355 +1% | $102,641 +0.7% |
| 2015 | $1,341 -0.9% | $101,928 +0.8% |
| 2014 | $1,353 | $101,120 -1.7% |
| 2013 | -- | $102,823 -3.4% |
| 2012 | -- | $106,410 -9.3% |
| 2011 | -- | $117,275 -13.4% |
| 2010 | -- | $135,437 -4.8% |
| 2009 | -- | $142,268 +5.7% |
| 2006 | -- | $134,621 +3% |
| 2005 | $1,963 | $130,700 +402.7% |
| 2004 | -- | $26,000 |
Find assessor info on the county website
Monthly payment
Est. payment
Payment breakdown
Explore the cost of this home by adjusting the details. Changes won't be saved.Climate risks
Neighborhood: Normandy Estate
- $234,6003 bd2 ba1.4k sqft9372 Thunderbolt Dr, Jacksonville, FL 32221Off Market
- $230,0003 bd2 ba1.2k sqft9360 Thunderbolt Dr, Jacksonville, FL 32221Off Market
- $280,6004 bd2 ba2.1k sqft9361 Lockheed Ln, Jacksonville, FL 32221Off Market

- $248,4003 bd2 ba1.6k sqft9367 Lockheed Ln, Jacksonville, FL 32221Off Market
Similar homes
- $325,0003 bd2 ba1.7k sqft11233 Revolutionary Way, Jacksonville, FL 32221For Sale By Owner

- $277,9003 bd2 ba1.8k sqft4648 FREMONT Street, Jacksonville, FL 32210For Sale
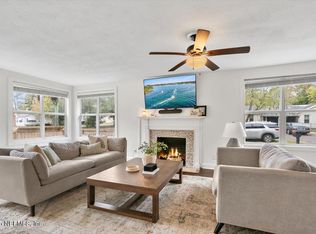 MLS ID #2172382, ROBERT SLOBOZIEN. realMLS
- $325,0004 bd2 ba1.7k sqft1327 PANTHER LAKE Parkway, Jacksonville, FL 32221For Sale
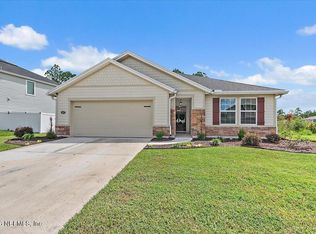 MLS ID #2162542, STEVE PATE. realMLS
- $295,0004 bd2 ba1.5k sqft7444 SWEET ROSE Lane, Jacksonville, FL 32244For Sale
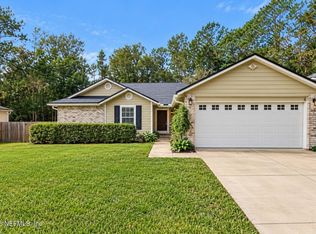 MLS ID #2171701, MARLA NEWMAN. realMLS
