94 S 21st Ave is a Manville home with 1,416 square feet of living space and a 1916 build year. The eat-in kitchen and connects to a mudroom near the rear entry. The three finished levels include main-floor living and dining areas plus a finished basement recreation space. Outside, a paver patio opens to a fenced backyard with room for seating and dining. The layout balances flexible gathering areas, useful entry storage, and multiple levels of finished living space.
Under contract
$450,000
94 S 21St Ave, Manville Boro, NJ 08835
3beds
1,416sqft
Single Family Residence
Built in 1916
5,662 Square Feet Lot
$471,300 Zestimate®
$318/sqft
$-- HOA
What's special
Eat-in kitchenFinished basement recreation spaceThree finished levelsUseful entry storageFlexible gathering areasPaver patio
- 37 days
- 251
- 22
Zillow last checked:
Listing updated:
Listed by:
Daniel Beirne 480-462-5392,
Opendoor Brokerage Llc
Source: GSMLS,MLS#: 4058105
Facts & features
Interior
Bedrooms & bathrooms
- Bedrooms: 3
- Bathrooms: 2
- Full bathrooms: 2
Kitchen
- Features: Eat-in Kitchen
Heating
- Forced Air, Natural Gas
Cooling
- Central Air
Appliances
- Included: Dishwasher, Microwave, Range/Oven-Gas
Features
- Basement: Yes,Full
- Has fireplace: No
Interior area
- Total structure area: 1,416
- Total interior livable area: 1,416 sqft
Property
Parking
- Parking features: 1 Car Width
Lot
- Size: 5,662 Square Feet
- Dimensions: 50 x 113
Details
- Parcel number: 2711000890000000040000
Construction
Type & style
- Home type: SingleFamily
- Property subtype: Single Family Residence
Materials
- Vinyl Siding
- Roof: Asphalt Shingle
Condition
- Year built: 1916
Utilities & green energy
- Gas: Gas-Natural
- Sewer: Public Sewer
- Water: Public
- Utilities for property: Electricity Connected, Natural Gas Connected
Community & HOA
Location
- Region: Manville
Financial & listing details
- Price per square foot: $318/sqft
- Tax assessed value: $406,000
- Annual tax amount: $7,914
- Date on market: 10/9/2026
- Ownership type: Fee Simple
- Electric utility on property: Yes
Estimated market value
$471,300
$448,000 - $495,000
$2,957/mo
Price history
| Date | Event | Price |
|---|---|---|
| 10/28/2026 | Pending sale | $450,000$318/sqft |
Source:  GSMLS #4058105 Report a problem | ||
| 10/9/2026 | Listed for sale | $450,000+0%$318/sqft |
Source: GSMLS #4058105 Report a problem | ||
| 6/27/2026 | Listing removed | $449,900$318/sqft |
Source: GSMLS #4022983 Report a problem | ||
| 5/15/2026 | Listing removed | $3,300$2/sqft |
Source: Zillow Rentals Report a problem | ||
| 5/4/2026 | Pending sale | $449,900$318/sqft |
Source: GSMLS #4022983 Report a problem | ||
| 4/24/2026 | Listed for sale | $449,900-7.2%$318/sqft |
Source: GSMLS #4022983 Report a problem | ||
| 3/31/2026 | Listing removed | $485,000$343/sqft |
Source: GSMLS #4010595 Report a problem | ||
| 3/7/2026 | Listed for rent | $3,300$2/sqft |
Source: Zillow Rentals Report a problem | ||
| 2/19/2026 | Listed for sale | $485,000+314.5%$343/sqft |
Source: GSMLS #4010595 Report a problem | ||
| 3/22/2019 | Sold | $116,995+11599.5%$83/sqft |
Source: GSMLS #3540937 Report a problem | ||
| 9/25/2018 | Sold | $1,000-99.5%$1/sqft |
Source: Public Record Report a problem | ||
| 8/25/2018 | Price change | $210,000+40%$148/sqft |
Source: RE/MAX PINNACLE #3497098 Report a problem | ||
| 8/18/2018 | Listed for sale | -- |
Source: Auction.com Report a problem | ||
| 7/11/2018 | Listing removed | $150,005-40.2%$106/sqft |
Source: Auction.com Report a problem | ||
| 6/23/2018 | Listed for sale | -- |
Source: Auction.com Report a problem | ||
| 10/29/2007 | Sold | $251,000+178.6%$177/sqft |
Source: Public Record Report a problem | ||
| 7/11/2000 | Sold | $90,100+137.1%$64/sqft |
Source: Public Record Report a problem | ||
| 10/3/1996 | Sold | $38,000$27/sqft |
Source: Public Record Report a problem | ||
Public tax history
| Year | Property taxes | Tax assessment |
|---|---|---|
| 2026 | $7,915 -6.3% | $406,000 +8.2% |
| 2025 | $8,444 +18.3% | $375,100 +18.3% |
| 2024 | $7,138 +0% | $317,100 +6.8% |
| 2023 | $7,135 +30.1% | $296,800 +33% |
| 2022 | $5,485 | $223,100 +20.3% |
| 2021 | -- | $185,500 +10.7% |
| 2020 | $6,812 -0.1% | $167,600 -19.6% |
| 2019 | $6,818 | $208,500 |
| 2018 | $6,818 +5.6% | $208,500 |
| 2017 | $6,459 -7.8% | $208,500 |
| 2016 | $7,002 +2% | $208,500 -28% |
| 2015 | $6,863 +3.3% | $289,700 |
| 2014 | $6,643 +5.5% | $289,700 |
| 2012 | $6,298 +2.5% | $289,700 |
| 2011 | $6,142 +2.3% | $289,700 |
| 2010 | $6,003 +0.9% | $289,700 +1% |
| 2009 | $5,948 | $286,800 |
| 2008 | -- | $286,800 |
| 2007 | -- | $286,800 +170.3% |
| 2006 | -- | $106,100 |
| 2005 | -- | $106,100 |
| 2004 | $3,332 | $106,100 |
| 2003 | -- | $106,100 |
| 2002 | -- | $106,100 |
| 2001 | -- | $106,100 |
Find assessor info on the county website
Monthly payment
Est. payment
Payment breakdown
Explore the cost of this home by adjusting the details. Changes won't be saved.Climate risks
Neighborhood: 08835
Similar homes
- $525,0003 bd3 ba1.5k sqft112 Valerie Dr, Manville, NJ 08835For Sale
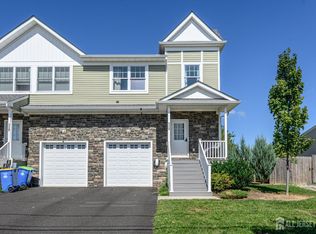
 MLS ID #2704566R, ROBERT DEKANSKI. All Jersey MLS
- $650,0003 bd2 ba1.5k sqft20 Claremont Dr, Hillsborough, NJ 08844For Sale
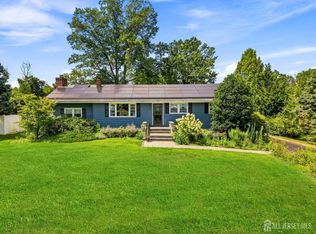 MLS ID #2707463R, MATTHEW ROWACK. All Jersey MLS
- $399,9993 bd1 ba1.2k sqft360 Alpine St, Perth Amboy, NJ 08861For Sale
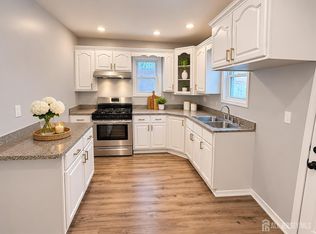 MLS ID #2707895R, KEIDY ". LOZADA. All Jersey MLS
- $450,0003 bd2 ba1.4k sqft82 Lewis St, Perth Amboy, NJ 08861For Sale
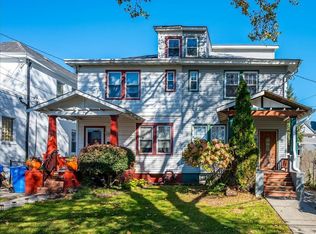 MLS ID #2707119R, RICHARD PHELAN. All Jersey MLS
- $425,0002 bd2 ba730 sqft110 Leslie St, Edison, NJ 08817For SaleMLS ID #2707746R, MICHELLE WASKO. All Jersey MLS
- $449,0003 bd2 ba1.1k sqft148 Stockton St, South Amboy, NJ 08879For SaleMLS ID #2700497R, MICHELE BABINO. All Jersey MLS
- $439,9992 bd3 ba1.2k sqft519 Sheffield Ct #2519, Piscataway, NJ 08854For SaleMLS ID #2707426R, KAREN M. GOLDBERG. All Jersey MLS
- $499,9003 bd1 ba1.7k sqft112 9th St, Piscataway, NJ 08854For SaleMLS ID #2705713R, JON KESSLER. All Jersey MLS
- $499,0003 bd2 ba1.7k sqft177 Buckelew Ave, Jamesburg, NJ 08831For SaleMLS ID #2701172R, MICHAEL MATTHEWS. All Jersey MLS
- $450,0003 bd2 ba1.1k sqft163 2nd St, South Amboy, NJ 08879For SaleMLS ID #2611040R, VERONICA HARY. All Jersey MLS
- $499,0002 bd2 ba1.3k sqft124 Redbud Rd, Piscataway, NJ 08854For SaleMLS ID #2707611R, GURJEET SINGH. All Jersey MLS
- $469,0005 bd2 ba2k sqft7 Exeter St, Highland Park, NJ 08904For SaleMLS ID #2706646R, RONNIE GLOMB. All Jersey MLS
- $568,0003 bd2 ba1.2k sqft36 Charles Ter, Piscataway, NJ 08854For SaleMLS ID #2706552R, ANGELICA RIOS-BETANCUR. All Jersey MLS
- $460,0003 bd2 ba1.6k sqft109 John St, South Amboy, NJ 08879For SaleMLS ID #2612550R, RYAN KNAB. All Jersey MLS
- $599,0003 bd3 ba1.7k sqft55 Nelson Ave S, Piscataway, NJ 08854For SaleMLS ID #2705463R, MOHAMMAD ALI. All Jersey MLS
- $555,0003 bd3 ba1.2k sqft1746 Elk St, Piscataway, NJ 08854For SaleMLS ID #2706693R, CHARLES T. FACCIPONTI. All Jersey MLS
