This 1632 square foot single family home has 3 bedrooms and 2.0 bathrooms. This home is located at 9510 Oakley Ln, Reno, NV 89521.
Pre-foreclosure
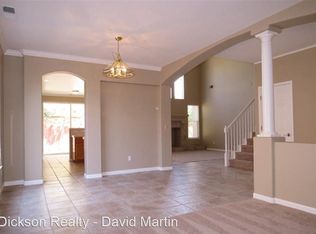
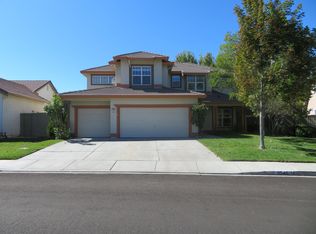
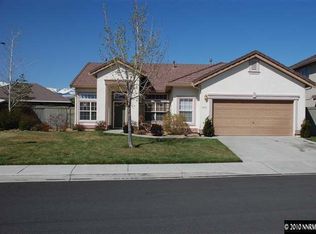
Street View
Est. $591,400
9510 Oakley Ln, Reno, NV 89521
3beds
2baths
1,632sqft
SingleFamily
Built in 1997
6,926 Square Feet Lot
$591,400 Zestimate®
$362/sqft
$594/mo HOA
Overview
- 79 days |
- 40 |
- 0 |
Facts & features
Interior
Bedrooms & bathrooms
- Bedrooms: 3
- Bathrooms: 2
Heating
- Forced air
Cooling
- Central
Features
- Has fireplace: Yes
Interior area
- Total interior livable area: 1,632 sqft
Property
Parking
- Parking features: Garage - Attached
Features
- Exterior features: Other, Stucco
Lot
- Size: 6,926 Square Feet
Details
- Parcel number: 16020107
Construction
Type & style
- Home type: SingleFamily
Materials
- Frame
- Roof: Tile
Condition
- Year built: 1997
Community & HOA
HOA
- Has HOA: Yes
- HOA fee: $594 monthly
Location
- Region: Reno
Financial & listing details
- Price per square foot: $362/sqft
- Tax assessed value: $306,042
- Annual tax amount: $3,192
Visit our professional directory to find a foreclosure specialist in your area that can help with your home search.
Find a foreclosure agentForeclosure details
Estimated market value
$591,400
$562,000 - $621,000
$2,763/mo
Price history
| Date | Event | Price |
|---|---|---|
| 9/25/2003 | Sold | $257,000+44.8%$157/sqft |
Source: Public Record Report a problem | ||
| 6/28/1999 | Sold | $177,500+4.4%$109/sqft |
Source: Public Record Report a problem | ||
| 8/22/1997 | Sold | $170,000$104/sqft |
Source: Public Record Report a problem | ||
Public tax history
| Year | Property taxes | Tax assessment |
|---|---|---|
| 2026 | $3,192 +3% | $107,115 -2.1% |
| 2025 | $3,098 +3% | $109,448 +7.6% |
| 2024 | $3,009 +3% | $101,745 -3.6% |
| 2023 | $2,921 +7.9% | $105,519 +23.8% |
| 2022 | $2,707 +6.3% | $85,235 +8.2% |
| 2021 | $2,547 +4.7% | $78,787 +4.3% |
| 2020 | $2,433 -4.5% | $75,557 |
| 2019 | $2,547 +4.7% | $75,557 +9.1% |
| 2018 | $2,433 -12.3% | $69,250 +3% |
| 2017 | $2,773 | $67,243 -0.8% |
| 2016 | $2,773 | $67,773 +5% |
| 2015 | $2,773 -14.1% | $64,554 +6.8% |
| 2014 | $3,228 | $60,437 +5.7% |
| 2013 | $3,228 | $57,202 |
| 2012 | -- | $57,202 +9.3% |
| 2011 | -- | $52,315 -12.4% |
| 2010 | -- | $59,709 -12.3% |
| 2009 | -- | $68,109 -5.3% |
| 2008 | -- | $71,915 -12.7% |
| 2007 | -- | $82,372 +30.2% |
| 2006 | -- | $63,272 +8.3% |
| 2005 | -- | $58,409 +2.2% |
| 2004 | -- | $57,137 +0.8% |
| 2003 | -- | $56,684 +0.7% |
| 2002 | -- | $56,294 |
| 2001 | -- | $56,294 |
Find assessor info on the county website
Monthly payment
Climate risks
Neighborhood: Double Diamond
Nearby schools
GreatSchools rating
- 6/10Double Diamond Elementary SchoolGrades: PK-5Distance: 0.3 mi
- 7/10Kendyl Depoali Middle SchoolGrades: 6-8Distance: 0.5 mi
- 7/10Damonte Ranch High SchoolGrades: 9-12Distance: 2.1 mi
- $659,5004 bd2 ba2k sqft9520 Oakley Ln, Reno, NV 89521Off Market
- $702,3004 bd3 ba2.4k sqft9490 Oakley Ln, Reno, NV 89521Off Market
- $699,4004 bd3 ba2.4k sqft9545 Comanche Moon Dr, Reno, NV 89521Off Market
- $601,0003 bd2 ba1.6k sqft9555 Comanche Moon Dr, Reno, NV 89521Off Market
- $659,0003 bd2 ba1.8k sqft9530 Oakley Ln, Reno, NV 89521For Sale
- $634,0004 bd2 ba1.8k sqft9470 Oakley Ln, Reno, NV 89521Off Market
- $683,1004 bd3 ba2.4k sqft1490 Cayuse Way, Reno, NV 89521Off Market
- $632,3004 bd3 ba2k sqft9535 Comanche Moon Dr, Reno, NV 89521Off Market
Similar homes
- $599,0003 bd2 ba1.9k sqft1472 Gaucho Ln, Reno, NV 89521Active

 MLS ID #260009689, Mandie Jensen, eXp Realty. NNRMLS
 - $574,8003 bd3 ba1.5k sqft1910 Black Sand Dr, Reno, NV 89521Active
 MLS ID #260009801, Jamie Slough, Realty Of America LLC. NNRMLS
 - $659,0003 bd2 ba1.8k sqft9530 Oakley Ln, Reno, NV 89521Active
 MLS ID #260009777, Lisa Williams, Berkshire Hathaway HomeService. NNRMLS
 - $589,9003 bd2 ba1.8k sqft9395 Oakley Ct, Reno, NV 89521Active
 MLS ID #260006471, Randi McCuan, LPT Realty, LLC. NNRMLS
 - $619,9004 bd2 ba1.6k sqft1611 Brentworth Way, Reno, NV 89521ActiveMLS ID #260009357, Jack Cote, RE/MAX Gold. NNRMLS
- $674,0004 bd3 ba2.1k sqft1600 Quail Bar Ct, Reno, NV 89521ActiveMLS ID #260009812, Amy Lang, Haute Properties NV. NNRMLS
- $590,0004 bd2 ba1.6k sqft9889 Northrup Dr, Reno, NV 89521ActiveMLS ID #260007051, Rachel Griego, OpenDoor Brokerage LLC. NNRMLS
- $595,0003 bd2 ba1.5k sqft1755 Ornellaia Way, Reno, NV 89521ActiveMLS ID #260008693, Allan Zane, Atlas Red Realty. NNRMLS
- $680,0003 bd2 ba1.9k sqft1445 Gold Cliff Ct, Reno, NV 89521ActiveMLS ID #260009627, Johanna Summersett, BHG Drakulich Realty. NNRMLS
- $575,0003 bd2 ba1.3k sqft10548 Bliss Ct, Reno, NV 89521ActiveMLS ID #260008896, Blake Williams, Sierra Sotheby's International. NNRMLS
- $560,0003 bd2 ba1.3k sqft2355 Soprano Dr, Reno, NV 89521ActiveMLS ID #260009394, Michael Zeno, RE/MAX Professionals-Reno. NNRMLS
- $755,0003 bd3 ba2.4k sqft9933 Rio Bravo Dr, Reno, NV 89521ActiveMLS ID #260009716, Trulie McCabe, Assist-2-Sell Buyers & Sellers. NNRMLS
- $747,9003 bd2 ba1.7k sqft2201 Dominic Dr, Reno, NV 89521ActiveMLS ID #260009810, Devin Scruggs, Dickson Realty - Caughlin. NNRMLS
- $625,0003 bd2 ba1.2k sqft10360 Rosemount Dr, Reno, NV 89521ActiveMLS ID #260009002, Pamela Fernandez, Lakeshore Realty. NNRMLS
- $598,0003 bd2 ba1.4k sqft535 Pesaro Way, Reno, NV 89521ActiveMLS ID #260008575, Jennifer Dicus, LPT Realty, LLC. NNRMLS
- $650,0003 bd3 ba1.7k sqft11099 Colton Dr, Reno, NV 89521ActiveMLS ID #260009444, Jonathan Lanuza-Gonzalez, Real Broker LLC. NNRMLS
- $626,0003 bd3 ba2.1k sqft9705 Pachuca Dr, Reno, NV 89521ActiveMLS ID #260006777, Michael Wood, RE/MAX Professionals-Reno. NNRMLS
- $620,0003 bd2 ba1.6k sqft10050 Ignacio Cir, Reno, NV 89521ActiveMLS ID #260004558, Erika Lamb, Welcome Home. NNRMLS
- $514,0003 bd3 ba1.7k sqft1801 Wind Ranch Rd Unit A, Reno, NV 89521ActiveMLS ID #260009797, Scott Taylor, Alder Properties. NNRMLS
- $729,9004 bd3 ba2.1k sqft9629 Thunder Mountain Way, Reno, NV 89521ActiveMLS ID #260008361, Kirsten Gardner, Dickson Realty - Downtown. NNRMLS
