This 1920 square foot single family home has 3 bedrooms and 1.0 bathrooms. This home is located at 96 Tavistock St, Springfield, MA 01119.
Foreclosed
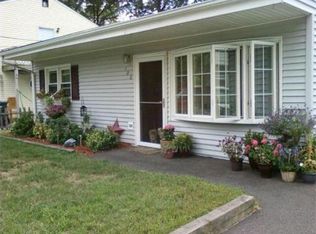
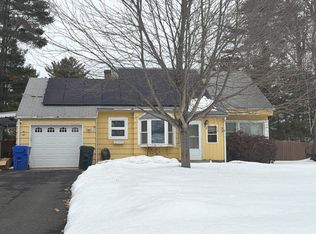
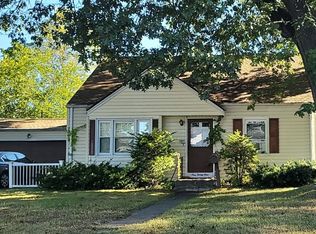
Street View
Est. $304,300
96 Tavistock St, Springfield, MA 01119
3beds
1baths
1,920sqft
SingleFamily
Built in 1953
4,791 Square Feet Lot
$304,300 Zestimate®
$158/sqft
$-- HOA
Overview
- 29 days |
- 11 |
- 0 |
Facts & features
Interior
Bedrooms & bathrooms
- Bedrooms: 3
- Bathrooms: 1
Heating
- Other, Oil
Features
- Basement: None
Interior area
- Total interior livable area: 1,920 sqft
Property
Features
- Exterior features: Other
Lot
- Size: 4,791 Square Feet
Details
- Parcel number: SPRIS11425P0029
Construction
Type & style
- Home type: SingleFamily
- Architectural style: Colonial
Condition
- Year built: 1953
Community & HOA
Location
- Region: Springfield
Financial & listing details
- Price per square foot: $158/sqft
- Tax assessed value: $264,600
- Annual tax amount: $4,149
Visit our professional directory to find a foreclosure specialist in your area that can help with your home search.
Find a foreclosure agentForeclosure details
Estimated market value
$304,300
$262,000 - $344,000
$2,553/mo
Price history
| Date | Event | Price |
|---|---|---|
| 5/20/2026 | Sold | $208,444$109/sqft |
Source: Public Record Report a problem | ||
Public tax history
| Year | Property taxes | Tax assessment |
|---|---|---|
| 2025 | $4,149 -3.5% | $264,600 -1.2% |
| 2024 | $4,299 +19% | $267,700 +26.3% |
| 2023 | $3,613 +4.4% | $211,900 +15.2% |
| 2022 | $3,461 +8.6% | $183,900 +9.1% |
| 2021 | $3,187 -0.6% | $168,600 +2.7% |
| 2020 | $3,206 +13% | $164,200 +13.9% |
| 2019 | $2,836 -4.3% | $144,100 -4.3% |
| 2018 | $2,964 +2.6% | $150,600 +2.5% |
| 2017 | $2,888 +17.4% | $146,900 +17.3% |
| 2016 | $2,461 +5.8% | $125,200 +5.9% |
| 2015 | $2,325 -6.4% | $118,200 -6.3% |
| 2014 | $2,485 +20.2% | $126,100 +20.2% |
| 2013 | $2,068 -18% | $104,900 -17.5% |
| 2012 | $2,522 +0.2% | $127,200 -1.5% |
| 2011 | $2,516 -8.1% | $129,100 -8% |
| 2010 | $2,738 +4.5% | $140,400 -4.1% |
| 2009 | $2,619 +5.4% | $146,400 -5.5% |
| 2008 | $2,485 -15.3% | $155,000 -15.3% |
| 2007 | $2,934 +28.4% | $182,900 +36.1% |
| 2006 | $2,285 +1.1% | $134,400 +4.1% |
| 2005 | $2,261 +64.2% | $129,100 +78.1% |
| 2004 | $1,377 +7.2% | $72,500 +9.5% |
| 2003 | $1,285 +0.7% | $66,200 +3.1% |
| 2002 | $1,276 | $64,200 |
Find assessor info on the county website
Monthly payment
Estimated monthly payment$1,822
All calculations are estimates and provided by Zillow, Inc. for informational purposes only. Actual amounts may vary.
HOA fees may include property taxes on listings classified as Co-Ops. Contact the listing agent and/or owner for fee details.
Mortgage interest rates are dependent on a number of factors, including credit score, down payment, and repayment length. Interest rate data provided by Zillow Group Marketplace, Inc. as of 1/1/1970 from various mortgage lenders with which we have lead or other similar arrangements; the Estimated Payment is an average of those rates.
See how much you could borrow to make a competitive offer.
Climate risks
Neighborhood: Boston Road
Nearby schools
GreatSchools rating
- 4/10Daniel B Brunton SchoolGrades: PK-5Distance: 3.2 mi
- 4/10John F Kennedy Middle SchoolGrades: 6-8Distance: 0.9 mi
- 1/10Springfield Public Day High SchoolGrades: 9-12Distance: 1 mi


- Massachusetts
- Hampden County
- Springfield
- 01119
- Boston Road
- 96 Tavistock St
Nearby cities
Nearby neighborhoods
Nearby zip codes
Other Springfield Topics
